Myths about teaching can hold you back


- Year 11•
- Higher


- Year 11•
- Higher
Constructing three event Venn diagrams
I can construct a three event Venn diagram.
These resources were made for remote use during the pandemic, not classroom teaching.
Switch to our new teaching resources now - designed by teachers and leading subject experts, and tested in classrooms.
Lesson details
Key learning points
- A three event Venn diagram is easier to complete if information from intersecting events is completed first
- Venn diagrams may show probabilities, frequencies or outcomes
- A three event Venn diagram may have some (or all) events being mutually exclusive
- A three event Venn diagram may have events which are subsets of other events
Keywords
Outcome - An outcome is a result of a trial (e.g. getting heads when flipping a coin once or getting two heads when flipping a coin twice).
Sample space - A sample space is all the possible outcomes of a trial. A sample space diagram is a systematic way of producing a sample space.
Event - An event is a subset of a sample space. i.e. An outcome or set of outcomes that may occur from a trial (e.g. flipping a coin twice and getting the same result each time).
Mutually exclusive - Two or more events are mutually exclusive if they share no common outcome.
Venn diagram - Venn diagrams are a representation used to model statistical/probability questions. Commonly circles are used to represent events.
Common misconception
There is often a lot of information to process, in order to complete a three event Venn diagram accurately. Pupils may confuse which region to complete.
A three event Venn diagram is easier to complete if information from intersecting events is completed first.
To help you plan your year 11 maths lesson on: Constructing three event Venn diagrams, download all teaching resources for free and adapt to suit your pupils' needs...
To help you plan your year 11 maths lesson on: Constructing three event Venn diagrams, download all teaching resources for free and adapt to suit your pupils' needs.
The starter quiz will activate and check your pupils' prior knowledge, with versions available both with and without answers in PDF format.
We use learning cycles to break down learning into key concepts or ideas linked to the learning outcome. Each learning cycle features explanations with checks for understanding and practice tasks with feedback. All of this is found in our slide decks, ready for you to download and edit. The practice tasks are also available as printable worksheets and some lessons have additional materials with extra material you might need for teaching the lesson.
The assessment exit quiz will test your pupils' understanding of the key learning points.
Our video is a tool for planning, showing how other teachers might teach the lesson, offering helpful tips, modelled explanations and inspiration for your own delivery in the classroom. Plus, you can set it as homework or revision for pupils and keep their learning on track by sharing an online pupil version of this lesson.
Explore more key stage 4 maths lessons from the Conditional probability unit, dive into the full secondary maths curriculum, or learn more about lesson planning.

Licence
Prior knowledge starter quiz
6 Questions
Q1.This probability Venn diagram shows the probability of a random spinner (spun once) landing on a square number or a factor of 36. Which of these probability statements are correct?
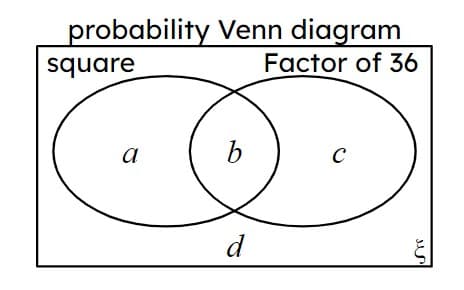
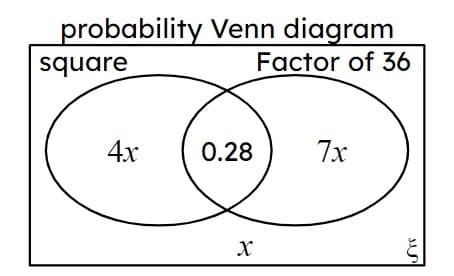
Q2.This probability Venn diagram shows the probability of a random spinner (spun once) landing on a square number or a factor of 36. The value of $$x$$ is . Give your answer as a decimal.
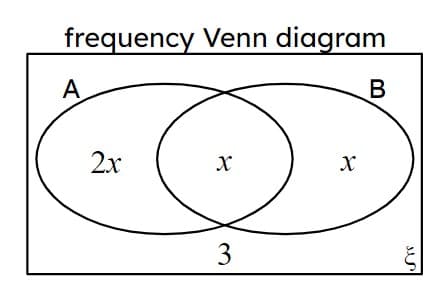
Q3.Here is a frequency Venn diagram. P(A ∩ B) = 0.2. The value of $$x$$ is .
Q4.P(C given D) = 0.4. Which of these equations is correct to find the value of $$x$$?

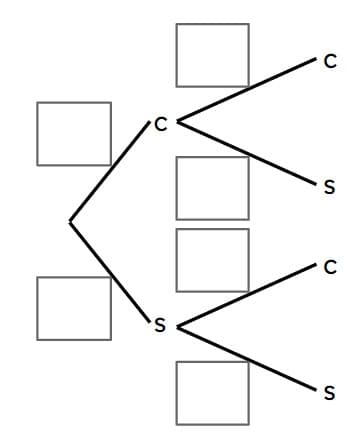
Q5.A pack of cards contains 50 “character” (c) cards and some “spell” (s) cards. A card is taken at random, replaced and a 2nd card is taken. P(two spell cards) = 0.25. There are cards in the deck.
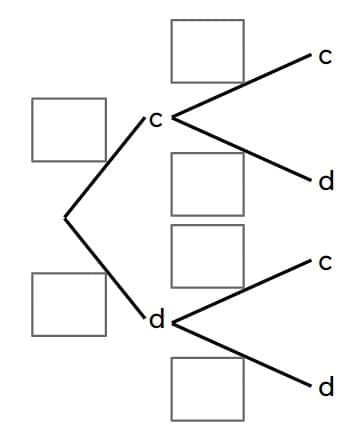
Q6.The ratio of cats (c) to dogs (d) in an animal shelter is 4 : 3. Two random animals are taken from the shelter for adoption. Find an expression for P(2 dogs).
Assessment exit quiz
6 Questions
Q1.A __________ space is all the possible outcomes of a trial.
Q2.Izzy asks 30 pupils if they take GCSE Art (A), GCSE Drama (D) or GCSE Music (M). The frequencies are shown in the Venn diagram. pupils take music but not drama.
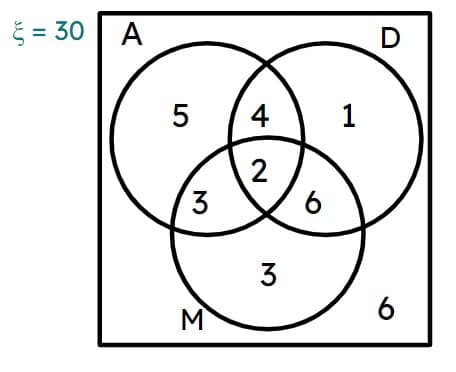
Q3.Izzy asks 30 pupils if they take GCSE Art (A), GCSE Drama (D) or GCSE Music (M). The frequencies are shown in the Venn diagram. pupils do not take drama.

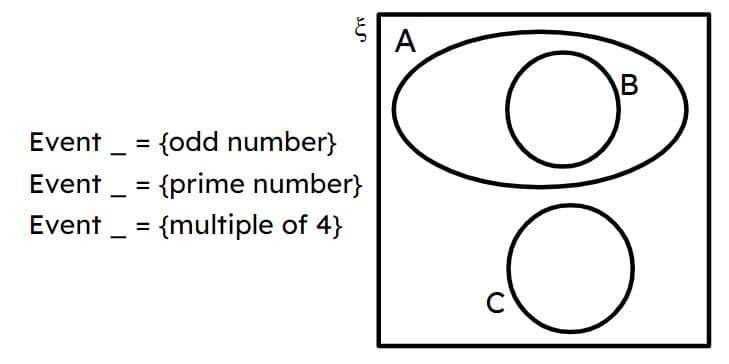
Q4.A spinner is numbered with the integers from 80 to 89. The incomplete outcome Venn diagram is used to display 3 events. Select the correct statements.
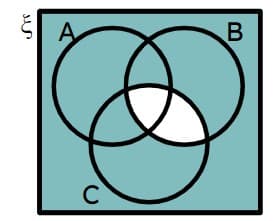
Q5.What region is shown shaded in this Venn diagram?
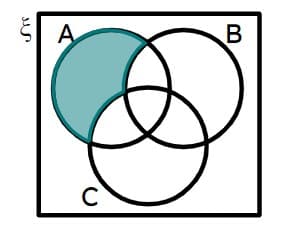
Q6.What region is shown shaded in this Venn diagram?
