New
New
Year 11
Higher

Probabilities in three event Venn diagrams

I can use a three event Venn diagram to calculate probabilities (including conditional).

New
New
Year 11
Higher

Probabilities in three event Venn diagrams

I can use a three event Venn diagram to calculate probabilities (including conditional).

warning

These resources will be removed by end of Summer Term 2025.

Switch to our new teaching resources now - designed by teachers and leading subject experts, and tested in classrooms.

Lesson details

Key learning points

  1. A three event Venn diagram can be used to calculate probabilities
  2. Three event Venn diagrams can be used to calculate the probability of a subset of events occurring
  3. A three event Venn diagram can be used to calculate conditional probabilities
  4. Three event Venn diagrams can be used to calculate conditional probabilities involving sets of events

Keywords

  • Venn diagrams - Venn diagrams are a representation used to model statistical/probability questions. Commonly circles are used to represent events.

  • Mutually exclusive - Mutually exclusive events have no outcomes in common.

  • Conditional probability - Conditional probability is the probability of an outcome occurring given that another event has occurred.

Common misconception

Pupils may give the probability as a fraction with the wrong denominator.

Check that pupils understand the difference between the probability of event A given B, P(A|B), and the probability of event A and B occurring.

Encourage pupils to draw/copy the Venn diagram and highlight or shade the regions that are needed for a given question.
Teacher tip

Licence

This content is © Oak National Academy Limited (2024), licensed on Open Government Licence version 3.0 except where otherwise stated. See Oak's terms & conditions (Collection 2).

Lesson video

Loading...

6 Questions

Q1.
An is a result of a trial in a probability experiment.
Correct Answer: outcome
Q2.
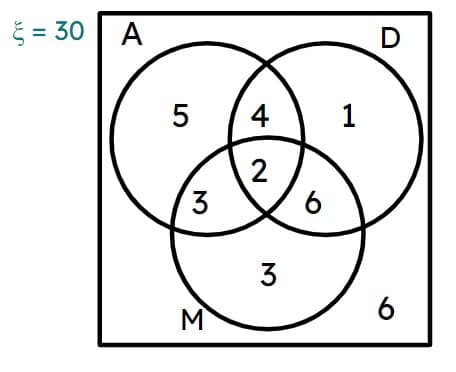
Izzy asks 30 pupils if they take GCSE Art (A), GCSE Drama (D) or GCSE Music (M). The frequencies are shown in the Venn diagram. pupils take drama but not music.
An image in a quiz
Correct Answer: 5, five
Q3.
Izzy asks 30 pupils if they take GCSE Art (A), GCSE Drama (D) or GCSE Music (M). The frequencies are shown in the Venn diagram. pupils do not take music.
An image in a quiz
Correct Answer: 16, sixteen
Q4.
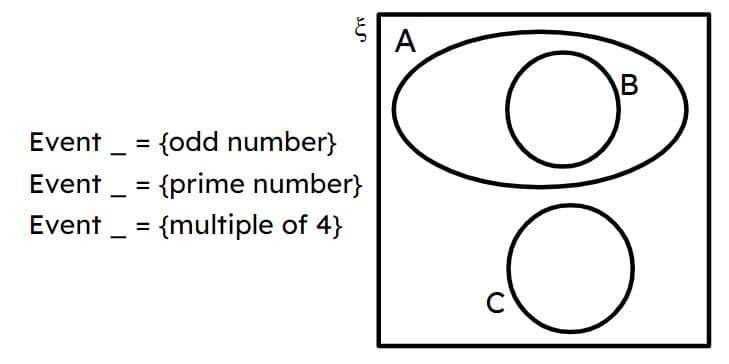
A spinner is numbered with the integers from 80 to 89. The incomplete outcome Venn diagram is used to display 3 events. Select the correct statements.
An image in a quiz
Event B is {multiples of 4}.
Correct answer: {odd numbers} and {multiples of 4} are mutually exclusive.
Event B has 3 elements.
{odd numbers} is a subset of {prime numbers}.
Correct answer: {prime numbers} is a subset of {odd numbers}.
Q5.
What region is shown shaded in this Venn diagram?
An image in a quiz
A ∪ B' ∪ C
A ∩ C ∪ B'
Correct answer: B'
A ∪ C
B' ∩ (A ∪ C)
Q6.
What region is shown shaded in this Venn diagram?
An image in a quiz
(A ⋂ B) ⋂ (A ⋂ C) ⋂ (B ⋂ C)
Correct answer: (A ⋂ B) ⋃ (A ⋂ C) ⋃ (B ⋂ C)
(A ⋃ B) ⋂ (A ⋃ C) ⋂ (B ⋃ C)
A' ⋃ B' ⋃ C'
A' ⋂ B' ⋂ C'

6 Questions

Q1.
Venn diagrams are a representation used to model statistical and probability questions. Commonly circles are used to represent...
Correct answer: events
frequencies
outcomes
probabilities
Q2.
Sam asks 30 pupils if they take GCSE Art (A), GCSE Drama (D) or GCSE Music (M). The frequencies are shown in the Venn diagram. Find P(A ∩ D).
An image in a quiz
$$2 \over30 $$
$$3 \over30 $$
$$5 \over30 $$
Correct answer: $$7 \over30 $$
$$13 \over30 $$
Q3.
Sam asks 30 pupils if they take GCSE Art (A), GCSE Drama (D) or GCSE Music (M). The frequencies are shown in the Venn diagram. Find P(A ⋃ D′).
An image in a quiz
$$15 \over30 $$
$$18 \over30 $$
$$19 \over30 $$
$$20 \over30 $$
Correct answer: $$21 \over30 $$
Q4.
Here is a frequency Venn diagram. P(A ∩ B ∩ C) = . Give your answer as a decimal.
An image in a quiz
Correct Answer: 0.14
Q5.
Here is a frequency Venn diagram. P(A′ ⋃ B' ⋃ C) = . Give your answer as a decimal.
An image in a quiz
Correct Answer: 0.88
Q6.
This frequency Venn diagram has 80 outcomes altogether. P(A ∩ B ∩ C) = $$\frac{1}{20}$$, P(A | B) = $$\frac{1}{3}$$ and P(A ⋃ B) = 0.7. $$x$$ = .
An image in a quiz
Correct Answer: 8