New
New
Year 11
Higher

Checking and securing understanding of inverse proportion graphs

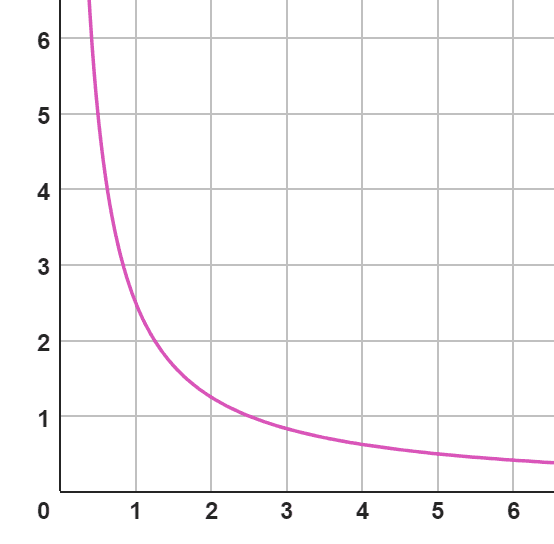
I can identify inverse proportion graphs from their features and can use the graph to create an equation to algebraically model this relationship.

New
New
Year 11
Higher

Checking and securing understanding of inverse proportion graphs

I can identify inverse proportion graphs from their features and can use the graph to create an equation to algebraically model this relationship.

warning

These resources will be removed by end of Summer Term 2025.

Switch to our new teaching resources now - designed by teachers and leading subject experts, and tested in classrooms.

Lesson details

Key learning points

  1. Inverse proportion can be recognised graphically.
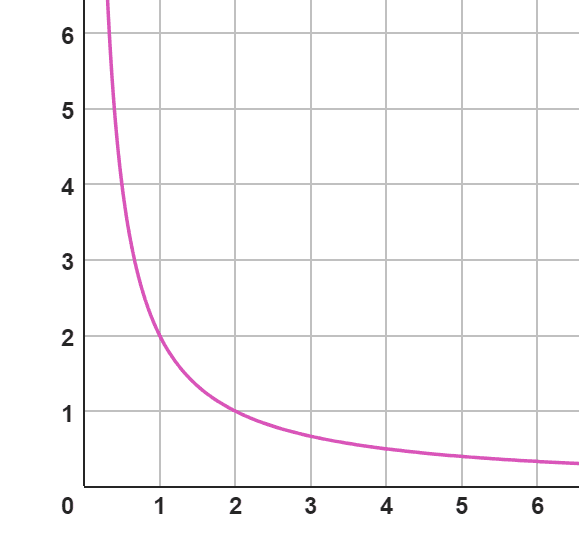
  2. An inverse proportion graph is always a curve that does not touch either axis.
  3. The equation is of the form y = k/x
  4. k is the constant of proportionality.

Keywords

  • Inverse proportion - Two variables are inversely proportional if there is a constant multiplicative relationship between one variable and the reciprocal of the other

Common misconception

Assuming the the graph will eventually intercept the axes.

Pupils can experiment with very large numbers. Here a spreadsheet is useful to generate numbers very quickly and show that although it gets very close to zero it never actually gets there.

Use Desmos to explore the features of graphs representing inverse proportion.
Teacher tip

Licence

This content is © Oak National Academy Limited (2024), licensed on Open Government Licence version 3.0 except where otherwise stated. See Oak's terms & conditions (Collection 2).

Lesson video

Loading...

6 Questions

Q1.
If two variables have a constant relationship, they are in direct proportion.
additive
Correct answer: multiplicative
decreasing
Q2.
Which of the following tables show values of A and B in direct proportion?
An image in a quiz
An image in a quiz
Correct Answer: An image in a quiz
An image in a quiz
Correct Answer: An image in a quiz
An image in a quiz
Q3.
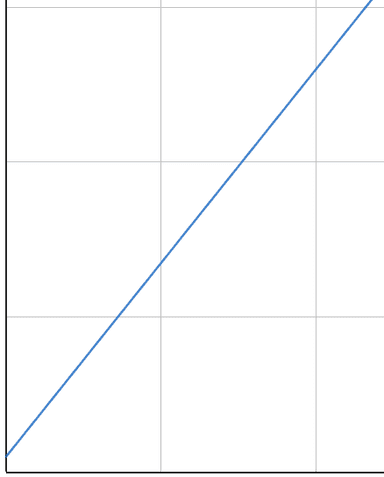
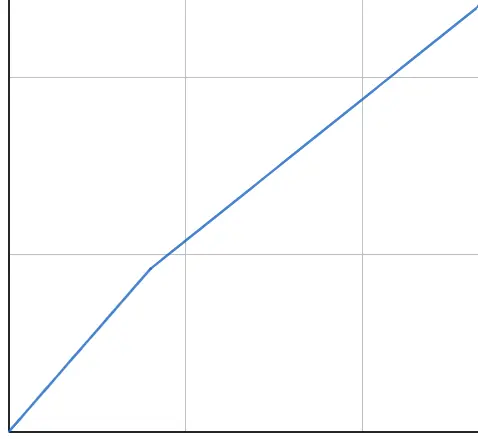
Which of the following graphs show direct proportion?
An image in a quiz
Correct Answer: An image in a quiz
An image in a quiz
Correct Answer: An image in a quiz
An image in a quiz
An image in a quiz
Q4.
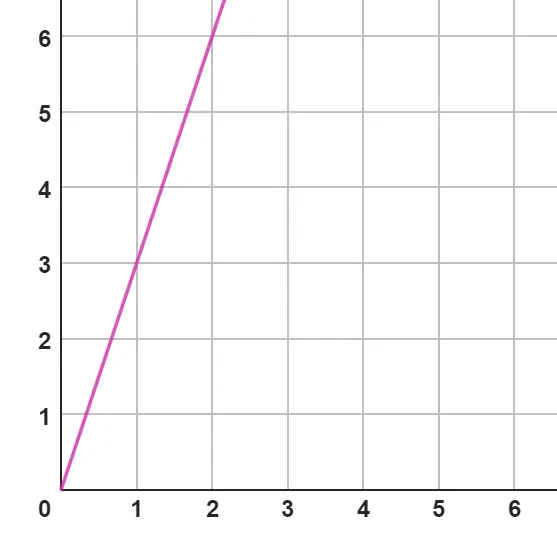
Calculate the value of k (constant of proportionality).
An image in a quiz
$$3\over5$$
$$1\over3$$
Correct answer: $$5\over3$$
3
Q5.
What is the equation of this line?
An image in a quiz
$$y={3\over5}$$
Correct answer: $$y={5\over3}x$$
$$y={5\over3}$$
$$y={3\over5}x$$
Q6.
Which is the graph of $$y={1\over3}x$$?
Correct answer: A
B
C
D

6 Questions

Q1.
Two variables are inversely proportional if there is a constant multiplicative relationship between one variable and the of the other.
Correct Answer: reciprocal
Q2.
Which of the following is an example of inverse proportion?
The number of euros exchanged and the number of pounds
The number of sweets and the number of bags of sweets
The number of kilometres travelled and the number of miles travelled
Correct answer: The time taken to build a wall and the number of people
The cost to fill a fuel tank and the size of the tank
Q3.
Which of the following is an equation representing inverse proportion?
$$y={{{50}\over{x}}+5}$$
Correct answer: $$y={{{50}\over{x}}}$$
$$y={{{50}\over{x}}-5}$$
$$y={{{x}\over{50}}}$$
Q4.
Which of the following are not true? A graph representing inverse proportion...
Correct answer: will appear in all 4 quadrants.
will not intersect the $$x$$ and $$y$$ axes.
will appear in only 2 quadrants.
Correct answer: will intersect the $$x$$ and $$y$$ axes.
Q5.
The the dividend, the closer to the origin the graph will be.
Correct Answer: smaller
Q6.
Which of the following is the graph of $$y={{{2.5}\over{x}}}$$?
An image in a quiz
Correct Answer: An image in a quiz
An image in a quiz
An image in a quiz
An image in a quiz