Myths about teaching can hold you back

- Year 10•
- Higher
Checking understanding of scatter graphs
I can plot and interpret data points on scatter graphs.
- Year 10•
- Higher
Checking understanding of scatter graphs
I can plot and interpret data points on scatter graphs.
Lesson details
Key learning points
- Data is given as pairs of values.
- The independent variable is placed on the horizontal axis.
- Placing the independent variable on the other axis reflects the data points in y=x but not the correlation type.
Keywords
Bivariate data - Bivariate data has two variables, where each data point for one variable has a corresponding data point for the other variable.
Scatter graph - A scatter graph is a visual representation for bivariate data. It can be useful when determining the nature of the relationship between the variables.
Independent variable - An independent (explanatory) variable is a measure that is predicted to have an effect on another variable.
Dependent variable - A dependent (response) variable is a measure whose value is predicted to be affected by an explanatory variable.
Common misconception
Pupils may be uncertain about which variable to plot on the horizontal axis if they are unsure about which is the independent variable and which is the dependent variable.
Getting it wrong should not affect your interpretations of the data too much and sometimes neither variable might be dependent on the other. If you are unsure, consider which variable seems the most likely to be affecting the other in context.
To help you plan your year 10 maths lesson on: Checking understanding of scatter graphs, download all teaching resources for free and adapt to suit your pupils' needs...
To help you plan your year 10 maths lesson on: Checking understanding of scatter graphs, download all teaching resources for free and adapt to suit your pupils' needs.
The starter quiz will activate and check your pupils' prior knowledge, with versions available both with and without answers in PDF format.
We use learning cycles to break down learning into key concepts or ideas linked to the learning outcome. Each learning cycle features explanations with checks for understanding and practice tasks with feedback. All of this is found in our slide decks, ready for you to download and edit. The practice tasks are also available as printable worksheets and some lessons have additional materials with extra material you might need for teaching the lesson.
The assessment exit quiz will test your pupils' understanding of the key learning points.
Our video is a tool for planning, showing how other teachers might teach the lesson, offering helpful tips, modelled explanations and inspiration for your own delivery in the classroom. Plus, you can set it as homework or revision for pupils and keep their learning on track by sharing an online pupil version of this lesson.
Explore more key stage 4 maths lessons from the Graphical representations of data: scatter graphs and time series unit, dive into the full secondary maths curriculum, or learn more about lesson planning.

Licence
Lesson video
Loading...
Prior knowledge starter quiz
6 Questions
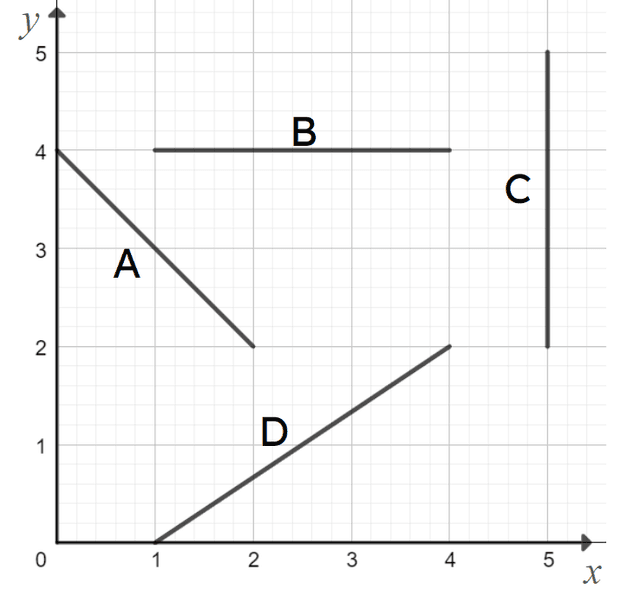
Q1.Which line segment has a negative gradient?
Q2.Which point on the graph has the coordinates (3, 1)? Point .
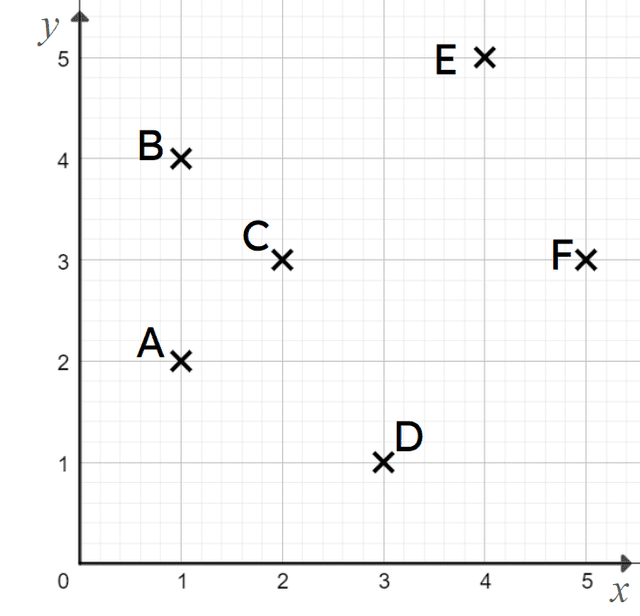
Q3.Which point on the graph has the coordinates (5, 3)? Point .
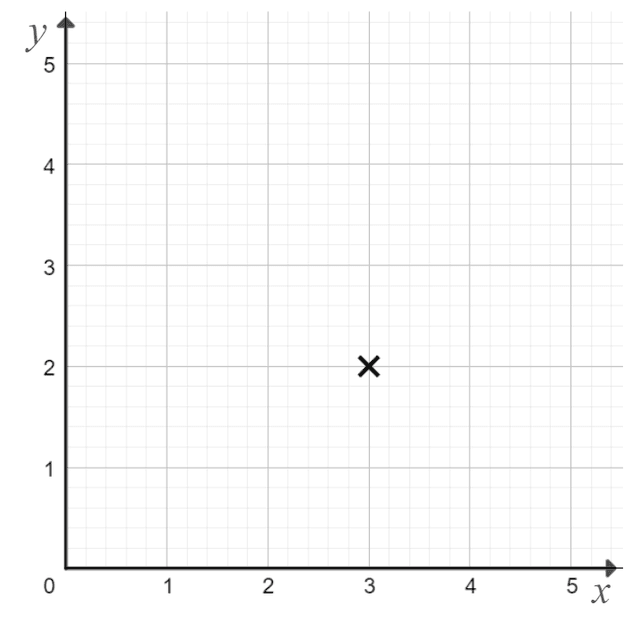
Q4.What are the coordinates of the point marked on this graph?
Q5.The value of $$a$$ on the horizontal axis is .
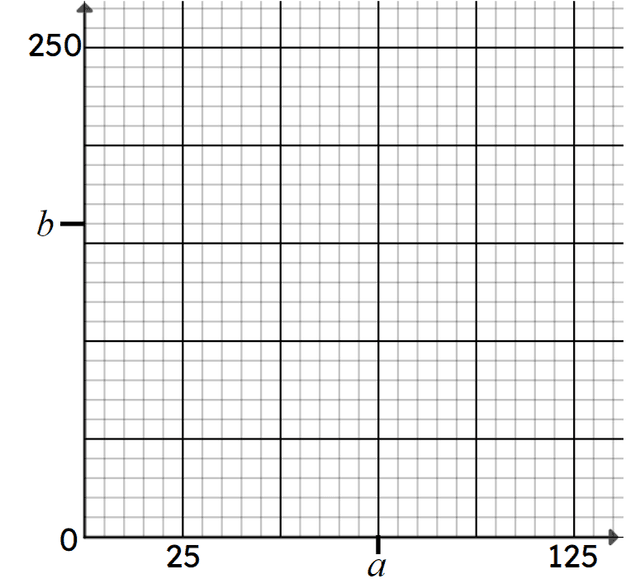
Q6.The value of $$b$$ on the vertical axis is .
Assessment exit quiz
6 Questions
Q1.A graph is a visual representation for bivariate data.
Q2.What is a variable that is predicted to have an effect on another variable called?
Q3.Match each type of variable to the axis it should be plotted on.
Independent variable -
horizontal axis
Dependent variable -
vertical axis
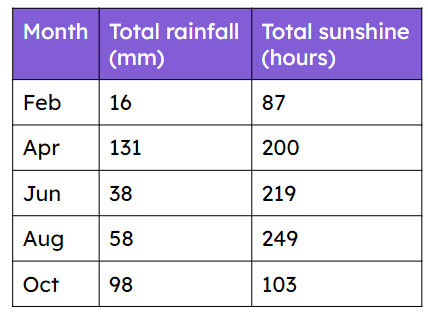
Q4.The table contains data taken from the Met Office about weather in Stornoway. Sofia plots a scatter graph with sunshine as the dependent variable. What coordinates should she plot for April?
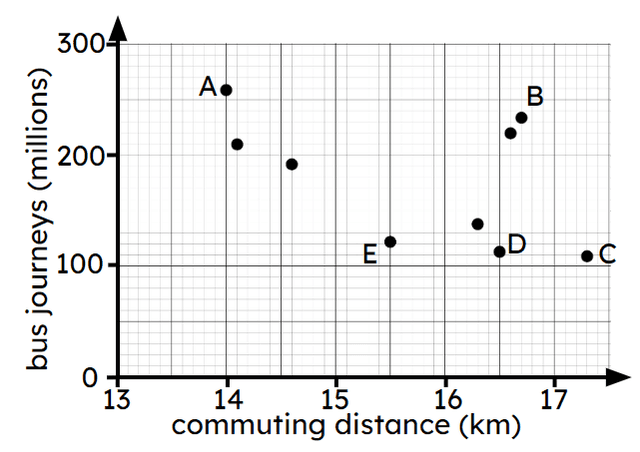
Q5.The graph shows travel data from the ONS about the commuting distance and the total number of bus journeys in 2023 for different regions of the UK. Which point shows the lowest commuting distance?
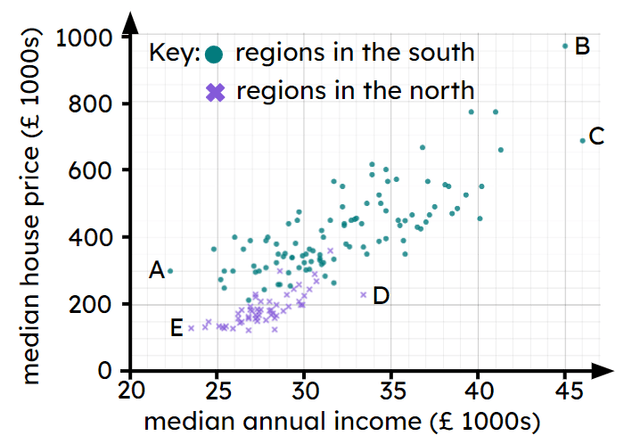
Q6.The scatter graph shows data taken from the ONS about house prices and annual income. Each point represents a region in England in 2023. Select the correct statements.