Interpreting time series graphs
I can interpret time series graphs, including commenting on trends.
Interpreting time series graphs
I can interpret time series graphs, including commenting on trends.
These resources will be removed by end of Summer Term 2025.
Switch to our new teaching resources now - designed by teachers and leading subject experts, and tested in classrooms.
These resources were created for remote use during the pandemic and are not designed for classroom teaching.
Lesson details
Key learning points
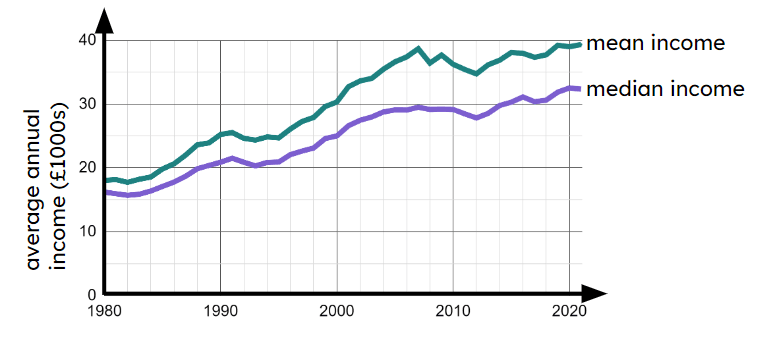
- The graph can be used to estimate a frequency at a given time
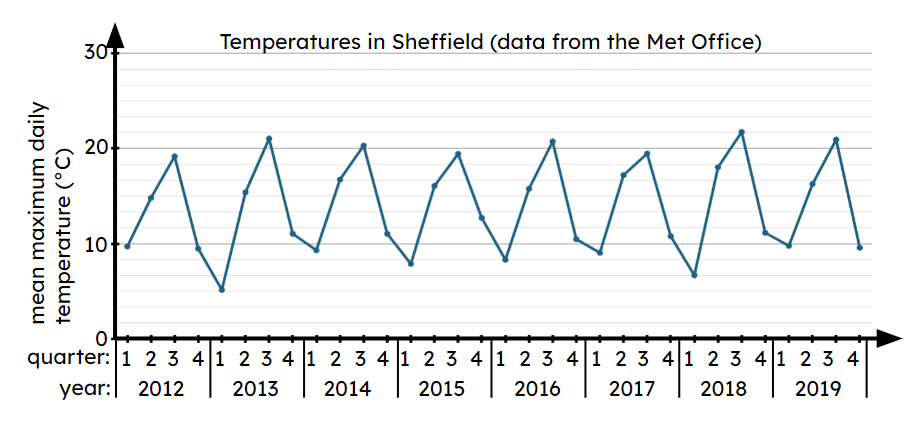
- Time series graphs can help us spot underlying trends or systematic patterns
- These trends can be interpreted in context and the context may explain the pattern seen
Keywords
Time series graphs - Time series graphs show data over a time period. The time period is always shown on the x-axis. Data points are joined chronologically by line segments.
Common misconception
Pupils may place too much confidence in the accuracy of predictions based on extrapolating time series graphs into the future.
While extrapolating a time series graph provide an indication of what future results may be, predictions are not guaranteed. Context should also be considered in these cases (e.g. whether there is a natural limit to how high a variable may reach).
To help you plan your year 10 maths lesson on: Interpreting time series graphs, download all teaching resources for free and adapt to suit your pupils' needs...
To help you plan your year 10 maths lesson on: Interpreting time series graphs, download all teaching resources for free and adapt to suit your pupils' needs.
The starter quiz will activate and check your pupils' prior knowledge, with versions available both with and without answers in PDF format.
We use learning cycles to break down learning into key concepts or ideas linked to the learning outcome. Each learning cycle features explanations with checks for understanding and practice tasks with feedback. All of this is found in our slide decks, ready for you to download and edit. The practice tasks are also available as printable worksheets and some lessons have additional materials with extra material you might need for teaching the lesson.
The assessment exit quiz will test your pupils' understanding of the key learning points.
Our video is a tool for planning, showing how other teachers might teach the lesson, offering helpful tips, modelled explanations and inspiration for your own delivery in the classroom. Plus, you can set it as homework or revision for pupils and keep their learning on track by sharing an online pupil version of this lesson.
Explore more key stage 4 maths lessons from the Graphical representations of data: scatter graphs and time series unit, dive into the full secondary maths curriculum, or learn more about lesson planning.

Licence
Lesson video
Loading...
Starter quiz
6 Questions

Exit quiz
6 Questions