Myths about teaching can hold you back

- Year 10
- Higher
Outliers in scatter graphs
I can recognise outliers and understand whether they should be included in the data set.
- Year 10
- Higher
Outliers in scatter graphs
I can recognise outliers and understand whether they should be included in the data set.
Lesson details
Key learning points
- Outliers can be visually seen on a scatter graph.
- Outliers do not necessarily occur at the start/end of the data set.
- Outliers must be carefully considered and only removed if they were recorded in error.
Keywords
Outlier - An outlier is a data point that is extremely large or small compared to the rest of the dataset. Visually, outliers lie far away from where the majority of the results are clustered.
Common misconception
An outlier always has values that are outside the range of the dataset (i.e. at the start or end of a dataset).
For bivariate data, a data point may be distinct from the rest of the data because the value of one of its variable is extremely less/greater than other points that have a similar value in its other variable.
To help you plan your year 10 maths lesson on: Outliers in scatter graphs, download all teaching resources for free and adapt to suit your pupils' needs...
To help you plan your year 10 maths lesson on: Outliers in scatter graphs, download all teaching resources for free and adapt to suit your pupils' needs.
The starter quiz will activate and check your pupils' prior knowledge, with versions available both with and without answers in PDF format.
We use learning cycles to break down learning into key concepts or ideas linked to the learning outcome. Each learning cycle features explanations with checks for understanding and practice tasks with feedback. All of this is found in our slide decks, ready for you to download and edit. The practice tasks are also available as printable worksheets and some lessons have additional materials with extra material you might need for teaching the lesson.
The assessment exit quiz will test your pupils' understanding of the key learning points.
Our video is a tool for planning, showing how other teachers might teach the lesson, offering helpful tips, modelled explanations and inspiration for your own delivery in the classroom. Plus, you can set it as homework or revision for pupils and keep their learning on track by sharing an online pupil version of this lesson.
Explore more key stage 4 maths lessons from the Graphical representations of data: scatter graphs and time series unit, dive into the full secondary maths curriculum, or learn more about lesson planning.

Licence
Lesson video
Loading...
Prior knowledge starter quiz
6 Questions
Q1.Extrapolation is when you estimate values that are the range of available data
Q2.Which values are obtained by interpolation on this scatter diagram?
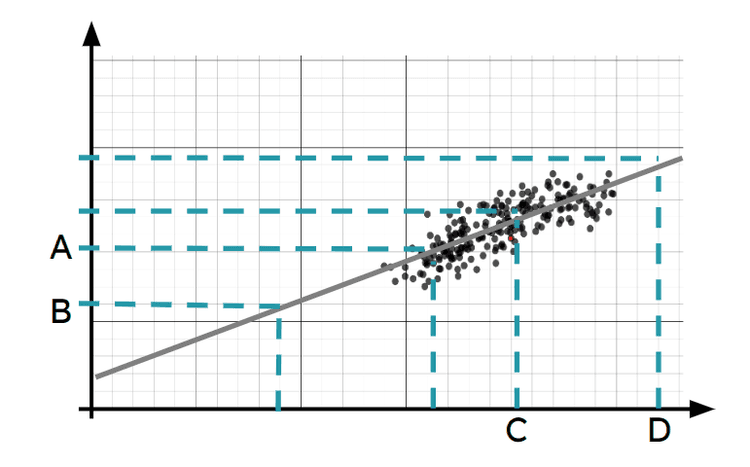
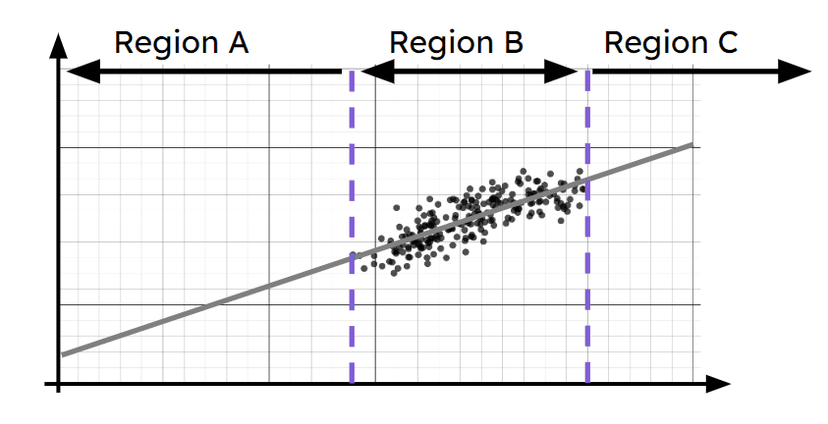
Q3.Select the regions where extrapolation can be used to make estimations on this scatter graph.
Q4.Alex says, “I can always use interpolation to make a valid prediction when my bivariate data has correlation.” Is Alex definitely correct?
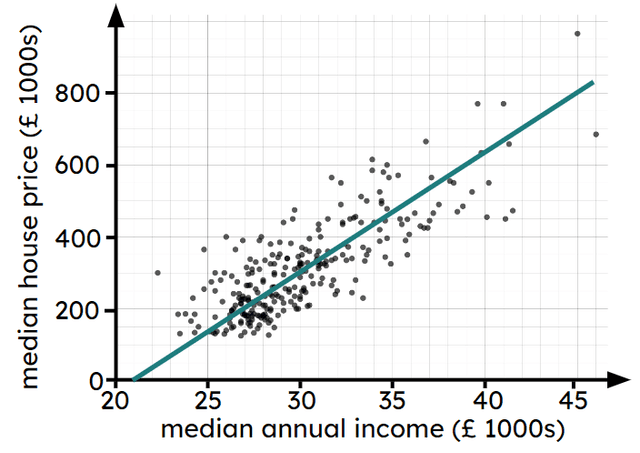
Q5.The scatter graph shows data taken from the ONS, where each point represents a region in England and Wales in 2023. Select which of these Oak pupils can use this graph to make an accurate prediction.
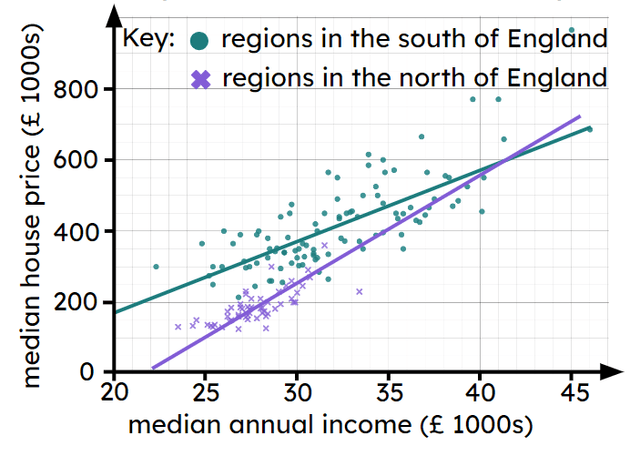
Q6.The scatter graphs shows information about house prices and income in different regions. Estimate the difference between the house prices in the North and South for a median income of £25 000
Assessment exit quiz
6 Questions
Q1.An is a data point that is extremely large or small compared to the rest of the dataset.
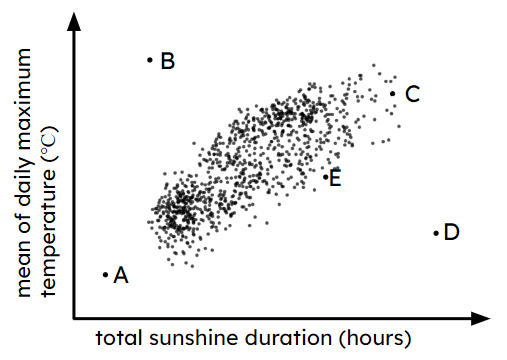
Q2.Which of these points are an outlier?
Q3.Sam says that it is possible to have a dataset with no outliers. Is Sam correct?
Q4.The scatter graph shows information about number of children and number of elderly people in a set of towns. Each point represents a town. Match each outlier to the correct statement.
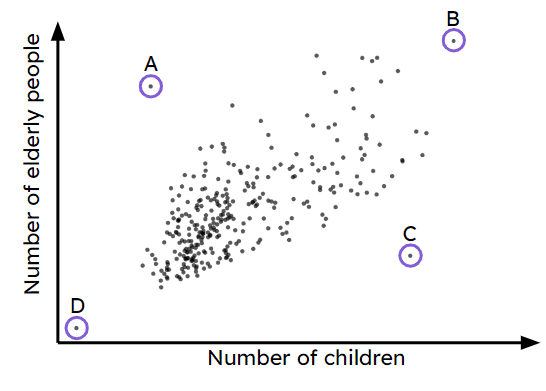
town with a low number of children and many elderly people
town with a high number of children and many elderly people
town with a high number of children and few elderly people
town with a low number of children and few elderly people