icon-background-square
New
New
Year 10
Higher

Graphs showing inverse proportion

I can recognise inverse proportion graphically and can interpret graphs that illustrate inverse proportion.

icon-background-square
New
New
Year 10
Higher

Graphs showing inverse proportion

I can recognise inverse proportion graphically and can interpret graphs that illustrate inverse proportion.

warning

These resources will be removed by end of Summer Term 2025.

Switch to our new teaching resources now - designed by teachers and leading subject experts, and tested in classrooms.

Lesson details

Key learning points

  1. Inverse proportion can be recognised graphically.
  2. The equation of an inverse proportion graph is of the form y = k/x
  3. An alternative way of writing the equation is y α 1/x

Keywords

  • Inverse proportion - Two variables are inversely proportional if there is a constant multiplicative relationship between one variable and the reciprocal of the other.

Common misconception

Solutions for context-based problem can be listed as coordinate pairs with units e.g. 6 workers, 60 hours.

Solutions should always be fully interpreted in relation to the context e.g. It would take 6 workers 60 hours to paint the building.

k is used in the notation to prepare pupils for the Year 11 unit where k is formally referred to as the constant of proportionality.
speech-bubble
Teacher tip
copyright

Licence

This content is © Oak National Academy Limited (2024), licensed on

except where otherwise stated. See Oak's terms & conditions (Collection 2).

Lesson video

Loading...

6 Questions

Q1.
If it takes 2 hours to walk 6 miles, 3 hours to walk 9 miles, and 4 hours to walk 12 miles then the variables time and distance are said to ...
Correct answer: be in direct proportion to each other.
be unrelated.
have a changing rate of change.
Q2.
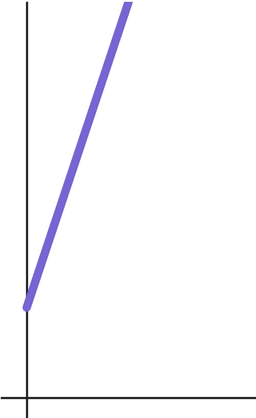
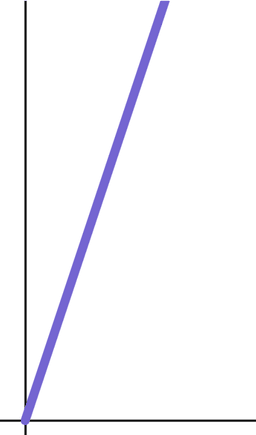
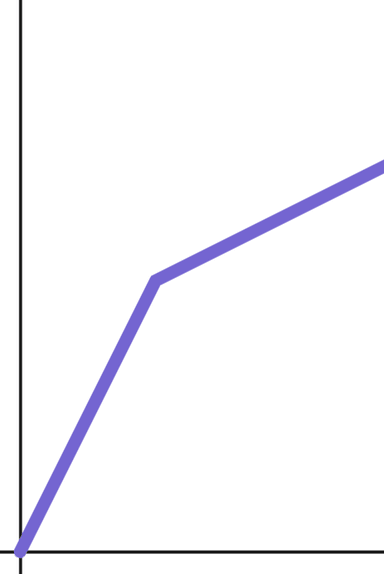
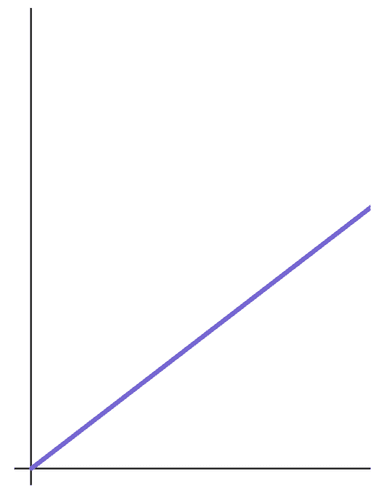
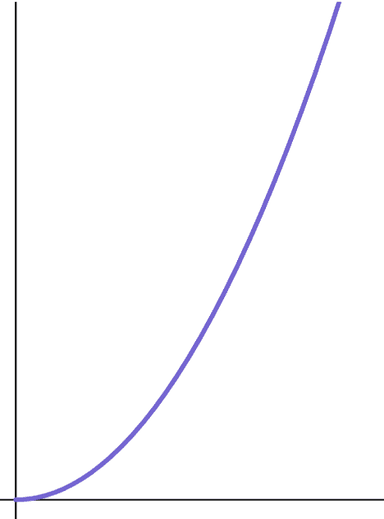
Which of these graphs shows a directly proportional relationship?
An image in a quiz
Correct Answer: An image in a quiz
An image in a quiz
An image in a quiz
Q3.
This time distance graph shows the relationship between the hours walked and the distance travelled in miles. What do the coordinates (5, 20) show?
An image in a quiz
It takes 5 hours to walk 20 km.
It takes 20 hours to walk 5 km.
Correct answer: It takes 5 hours to walk 20 miles.
It takes 20 hours to walk 5 miles.
Q4.
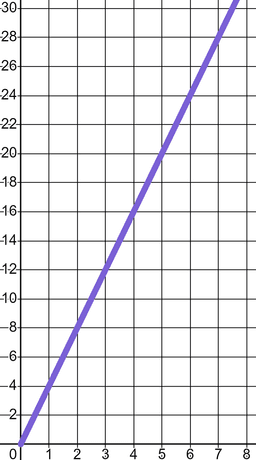
What is the equation of the line in this distance-time graph? Use $$d$$ for distance travelled and $$t$$ for time taken.
An image in a quiz
$$d=5t$$
$$t=5d$$
Correct answer: $$d=4t$$
$$4d=t$$
$$d=t+4$$
Q5.
For the equation $$s={30\over{t}}$$, when $$t=7.5$$, $$s=$$ .
Correct Answer: 4, s=4
Q6.
For the equation $$s={30\over{t}}$$, when $$s=7.5$$, $$t=$$
Correct Answer: 4, t=4

6 Questions

Q1.
When two variables are indirectly proportional, as one variable increases the other ...
increases.
Correct answer: decreases.
remains constant.
Q2.
Inversely proportional relationships are modelled by the relationship ...
$$ky=x$$
$$y=kx$$
$$y={x\over{k}}$$
Correct answer: $$y={k\over{x}}$$
Q3.
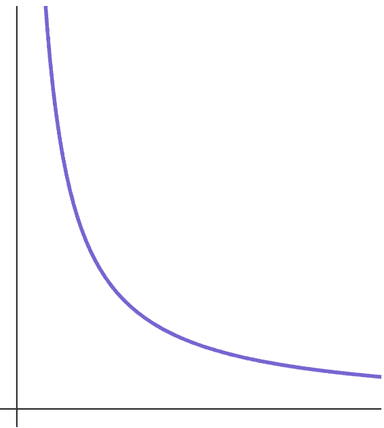
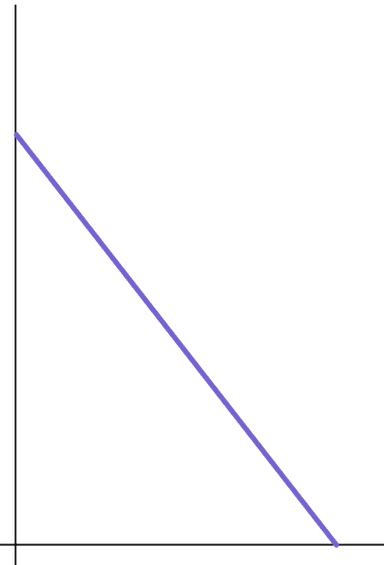
Which of these graphs shows a relationship of indirect proportion?
An image in a quiz
Correct Answer: An image in a quiz
An image in a quiz
An image in a quiz
An image in a quiz
Q4.
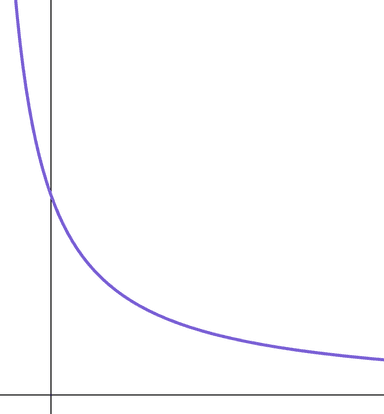
Why can this not be a graph of indirect proportion?
An image in a quiz
Correct answer: Indirect proportion graphs do not intersect either axis.
It is not a straight line.
It is decreasing as the horizontal variable decreases.
Correct answer: Indirect graphs have the form $$y={k\over{x}}$$ , dividing by zero is undefined.
Q5.
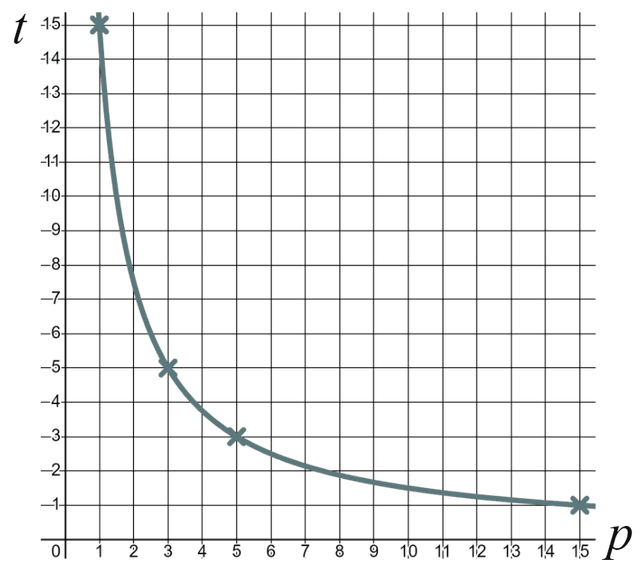
This graph plots the time taken ($$t$$) in days for a varying number of people ($$p$$) to dig a hole. How long would it take 3 people?
An image in a quiz
3
5
5 people
Correct answer: It would take 3 people 5 days to dig the hole.
It would take 5 people 3 days to dig the hole.
Q6.
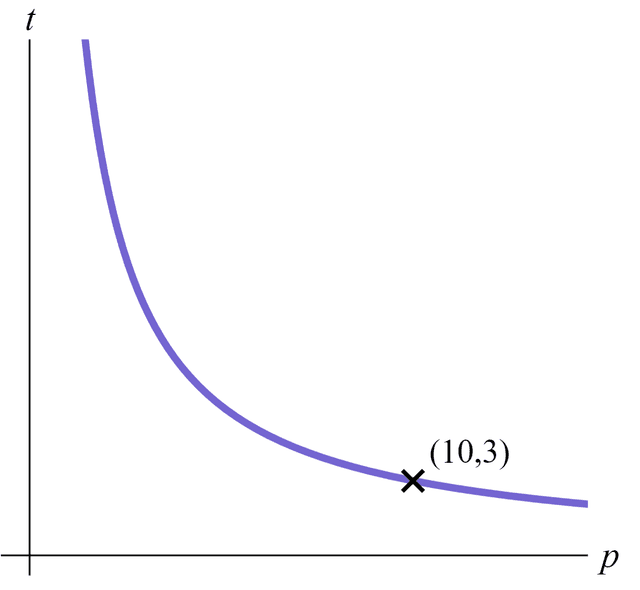
This graph shows the relationship between people and time required to build a wall. The point marked shows that 10 people would take 3 days. It would take 3 people days to build the wall.
An image in a quiz
Correct Answer: 10, Ten