Myths about teaching can hold you back


- Year 11•
- Higher
Drawing the sine and cosine graphs
I can draw the graphs for the trigonometric functions sine and cosine.


- Year 11•
- Higher
Drawing the sine and cosine graphs
I can draw the graphs for the trigonometric functions sine and cosine.
These resources will be removed by end of Summer Term 2025.
Switch to our new teaching resources now - designed by teachers and leading subject experts, and tested in classrooms.
These resources were created for remote use during the pandemic and are not designed for classroom teaching.
Lesson details
Key learning points
- The unit circle can help you predict what the graphs of the trigonometric functions will look like
- The sine and cosine graphs have y values between −1 and 1
Keywords
Trigonometric functions - Trigonometric functions are commonly defined as ratios of two sides of a right-angled triangle for a given angle.
Sine function - The sine of an angle (sin(θ°)) is the y-coordinate of point P on the triangle formed inside the unit circle.
Cosine function - The cosine of an angle (cos(θ°)) is the x-coordinate of point P on the triangle formed inside the unit circle.
Common misconception
Pupils may have their calculator set to radians instead of degrees.
The first check for understanding is designed to catch this but it is worth checking that the correct unit of measurement is being used throughout the lesson.
To help you plan your year 11 maths lesson on: Drawing the sine and cosine graphs, download all teaching resources for free and adapt to suit your pupils' needs...
To help you plan your year 11 maths lesson on: Drawing the sine and cosine graphs, download all teaching resources for free and adapt to suit your pupils' needs.
The starter quiz will activate and check your pupils' prior knowledge, with versions available both with and without answers in PDF format.
We use learning cycles to break down learning into key concepts or ideas linked to the learning outcome. Each learning cycle features explanations with checks for understanding and practice tasks with feedback. All of this is found in our slide decks, ready for you to download and edit. The practice tasks are also available as printable worksheets and some lessons have additional materials with extra material you might need for teaching the lesson.
The assessment exit quiz will test your pupils' understanding of the key learning points.
Our video is a tool for planning, showing how other teachers might teach the lesson, offering helpful tips, modelled explanations and inspiration for your own delivery in the classroom. Plus, you can set it as homework or revision for pupils and keep their learning on track by sharing an online pupil version of this lesson.
Explore more key stage 4 maths lessons from the Non right-angled trigonometry unit, dive into the full secondary maths curriculum, or learn more about lesson planning.

Licence
Prior knowledge starter quiz
6 Questions
Q1.Match the trigonometric ratio with the correct definition.
The sine of an angle is the -
$$y$$-coordinate (P) on the triangle formed inside the unit circle.
The cosine of an angle is the -
$$x$$-coordinate (P) on the triangle formed inside the unit circle.
The tangent is the -
line that intersects the circle exactly once.
Q2.Match the following values.
0 -
$$\sin(0°)$$
0.5 -
$$\sin(30°)$$
$$\frac{\sqrt{2}}{2}$$ -
$$\sin(45°)$$
$$\frac{\sqrt{3}}{2}$$ -
$$\sin(60°)$$
1 -
$$\sin(90°)$$
0.985 (3 s.f) -
$$\sin(100°)$$
Q3.Match the following values.
1 -
$$\cos(0°)$$
$$\frac{\sqrt{3}}{2}$$ -
$$\cos(30°)$$
$$\frac{\sqrt{2}}{2}$$ -
$$\cos(45°)$$
0.5 -
$$\cos(60°)$$
0 -
$$\cos(90°)$$
-0.174 (3 s.f) -
$$\cos(100°)$$
Q4.A right-angled triangle is drawn and an angle $$x$$ is indicated. The opposite length is 3 cm and the adjacent length is 2 cm. Work out the angle $$x$$°. Give your answer to 1 decimal place.
Q5.A right-angled triangle is drawn and an angle $$x$$ is indicated. The opposite length is 8 cm and the hypotenuse length is 16 cm. Work out the angle $$x$$°.
Q6.Jun draws a square with lengths 7 cm. What is the angle between the diagonals and the length 7 cm?
Assessment exit quiz
6 Questions
Q1.The __________ allows us to work out values for $$\sin(\theta°)$$ and $$\cos(\theta°)$$.
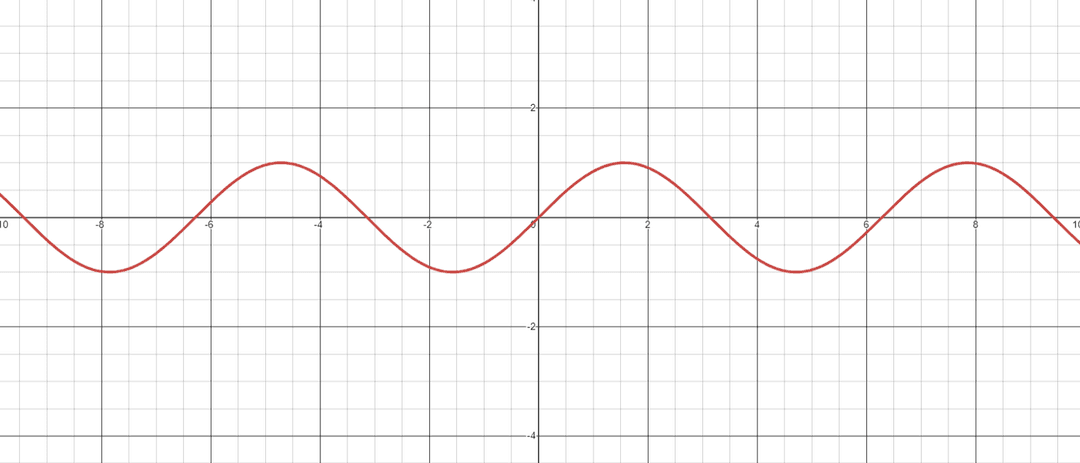
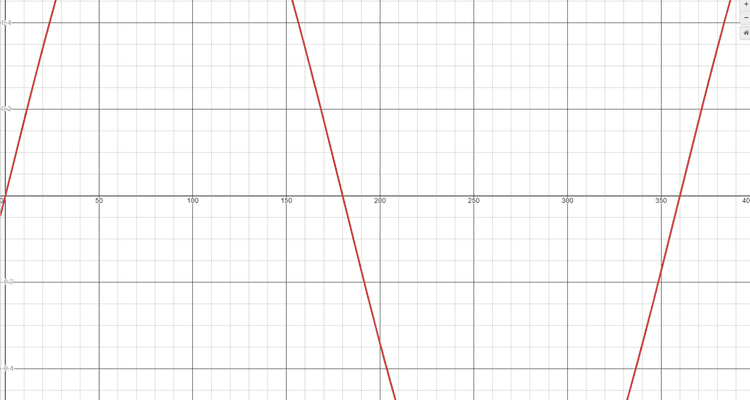
Q2.Andeep wants a sine graph from 0° to 360°. He opened Desmos and typed in "y=sin(x)". This image appears. What does Andeep need to do to see the sine graph between 0° and 360° degrees?

Q3.Andeep wants a sine graph from 0° to 360°. He opened Desmos and typed in "y=sin(x)". This image appears. What does Andeep need to do to see the full sine graph between 0° and 360°?


