New
New
Year 11
Higher

Checking and securing understanding of reading from context-based graphs

I can interpret graphs that model real-life situations graphically.

New
New
Year 11
Higher

Checking and securing understanding of reading from context-based graphs

I can interpret graphs that model real-life situations graphically.

Lesson details

Key learning points

  1. Distance-time graphs can tell you about a journey.
  2. By reading the graph, you can tell if there is mistake with it.

Common misconception

The line on a distance time graph can go in any direction.

The line may be horizontal, time changing without a change in distance, but it cannot be vertical. That would be a change in distance without a change in time. Additionally, our line cannot go backwards; time is always moving forwards.

Keywords

  • Rate of change - The rate of change is how one variable changes with respect to another. If the change is constant, there is a linear relationship between the variables.

Pupils can use their own water bottles to sketch their own graphs. They could compare depth time graphs of different containers by sketching on the same graph. If the containers have the same capacity but different shapes what will those graphs look like? What parts of the graph will be steeper?
Teacher tip

Licence

This content is © Oak National Academy Limited (2024), licensed on Open Government Licence version 3.0 except where otherwise stated. See Oak's terms & conditions (Collection 2).

Loading...

6 Questions

Q1.
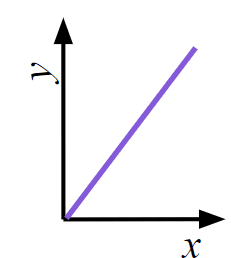
If the rate of change between two variables is constant, then the relationship between them is __________
Correct answer: linear
parabolic
regular
variable
Q2.
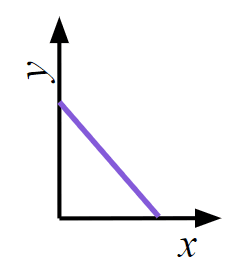
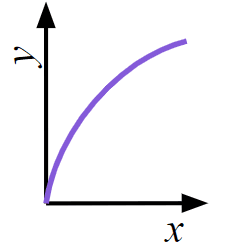
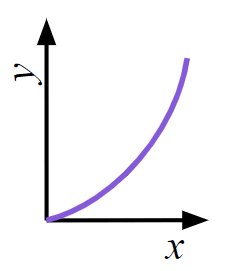
Which of these shows a constant rate of change between $$x$$ and $$y$$?
Correct Answer: An image in a quiz
An image in a quiz
Correct Answer: An image in a quiz
An image in a quiz
An image in a quiz
An image in a quiz
Q3.
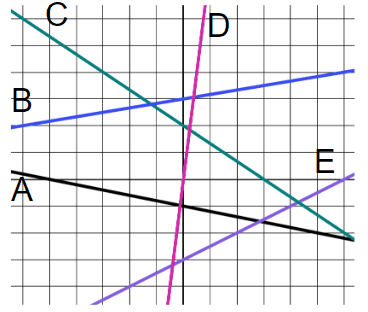
Which of these lines have negative gradient?
An image in a quiz
Correct answer: A (black)
B (blue)
Correct answer: C (green)
D (pink)
E (purple)
Q4.
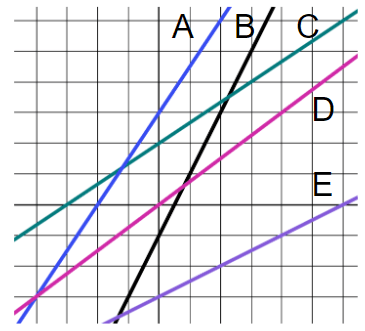
Starting with the steepest, put these lines in order of steepness.
An image in a quiz
1 - B (black)
2 - A (blue)
3 - D (pink)
4 - C (green)
5 - E (purple)
Q5.
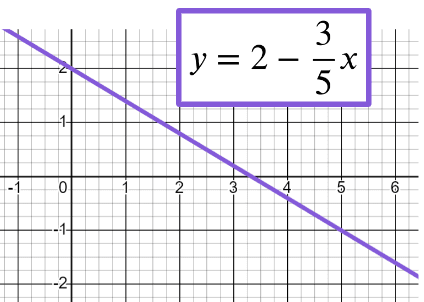
The solution to the equation $$2-\frac{3}{5}x = -1$$ is $$x = $$ . Use the graph to help you.
An image in a quiz
Correct Answer: 5
Q6.
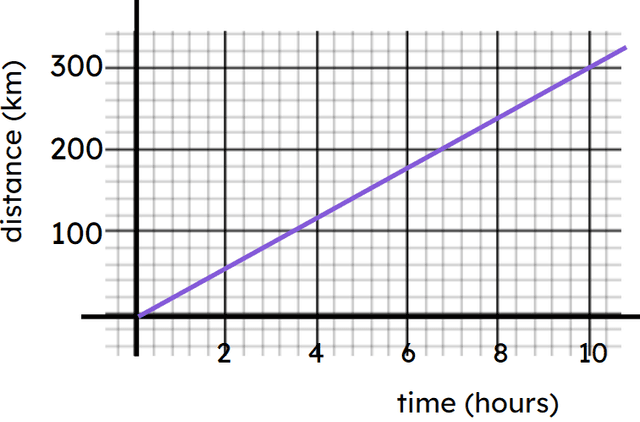
Using this distance-time graph, calculate the distance travelled after 4 hours.
An image in a quiz
Correct Answer: 120 km, 120km, 120 kilometres

6 Questions

Q1.
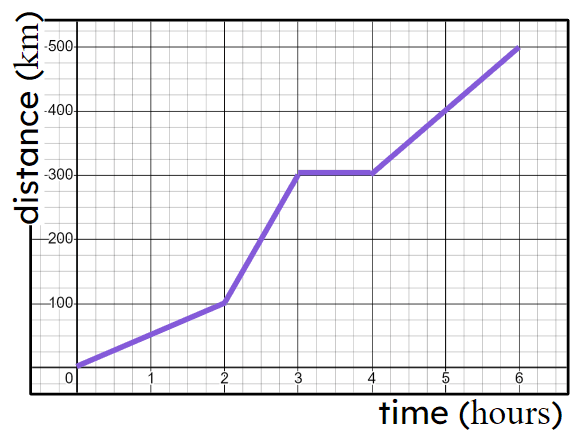
Here is a distance-time graph of a journey. When was the object moving the fastest?
An image in a quiz
Between 0 and 2 hours.
Correct answer: Between 2 and 3 hours.
Between 3 and 4 hours.
Between 4 and 6 hours.
Q2.
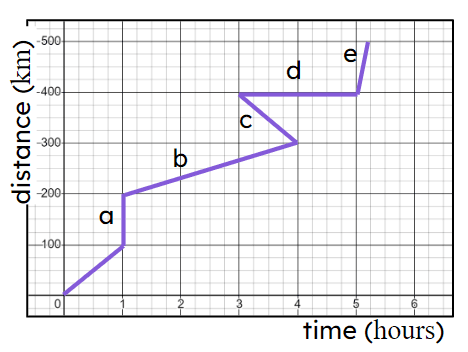
Which sections of this graph are impossible?
An image in a quiz
Correct answer: a
b
Correct answer: c
d
e
Q3.
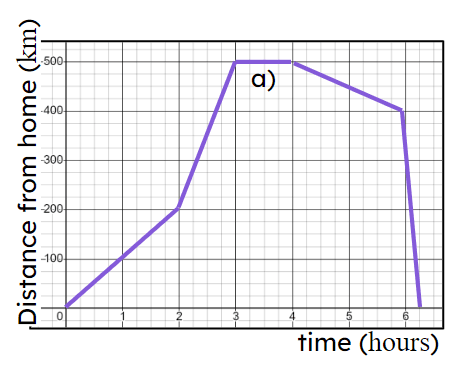
On this 'distance from home' graph, which of these best describes what is happening at a)?
An image in a quiz
Object is moving at a constant speed away from home.
Correct answer: Object is stationary.
Object is moving at a constant speed towards home.
Object is accelerating.
Object is decelerating.
Q4.
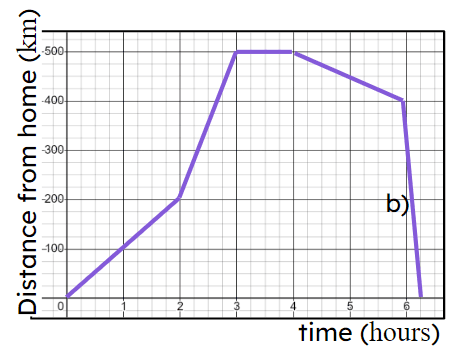
On this 'distance from home' graph, which of these best describes what is happening at b)?
An image in a quiz
Object is accelerating.
Object is moving at its fastest speed away from home.
Object is moving at its slowest speed away from home.
Correct answer: Object is moving at its fastest speed towards home.
Object is moving at its slowest speed towards home.
Q5.
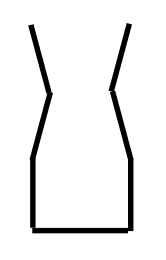
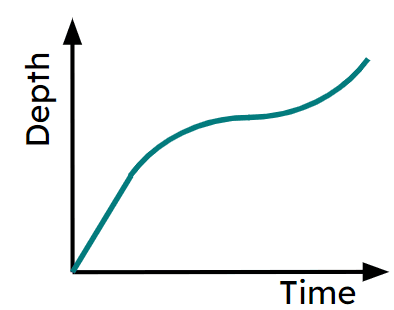
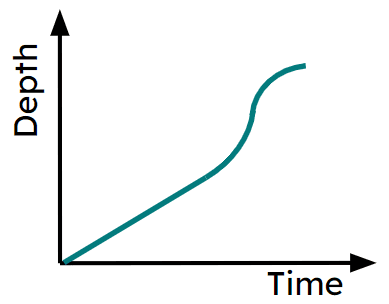
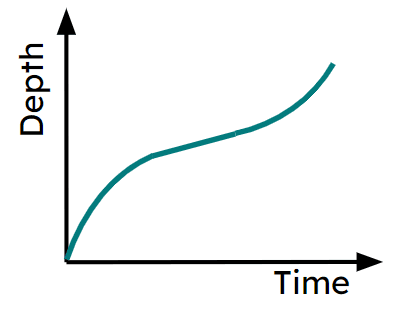
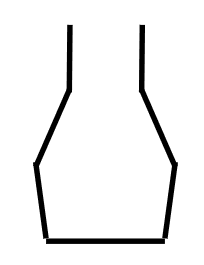
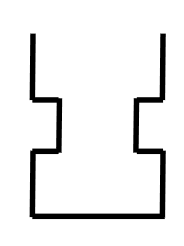
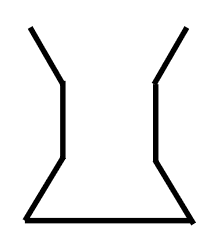
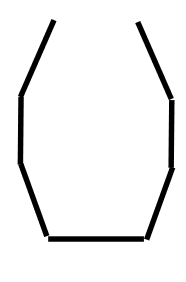
Assuming it is filled at a constant rate, which of these could be a depth-time graph for this container?
An image in a quiz
An image in a quiz
Correct Answer: An image in a quiz
An image in a quiz
An image in a quiz
Q6.
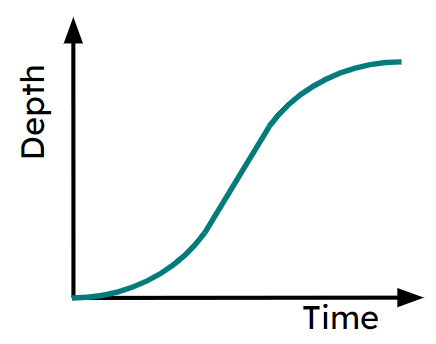
Assuming they were filled at a constant rate, which container could this depth-time graph represent?
An image in a quiz
Correct Answer: An image in a quiz
An image in a quiz
An image in a quiz