New
New
Year 11
Higher

Estimating journeys from non-linear graphs

I can estimate the distance travelled for non-linear speed-time graphs.

New
New
Year 11
Higher

Estimating journeys from non-linear graphs

I can estimate the distance travelled for non-linear speed-time graphs.

Lesson details

Key learning points

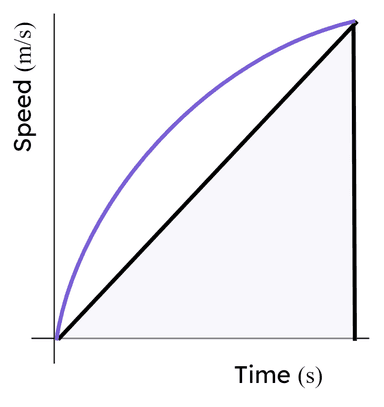
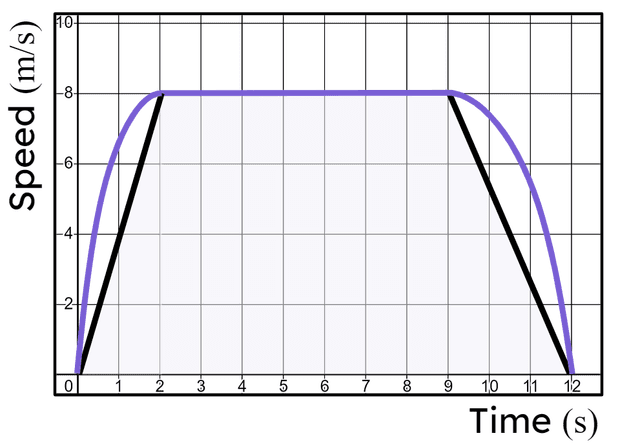
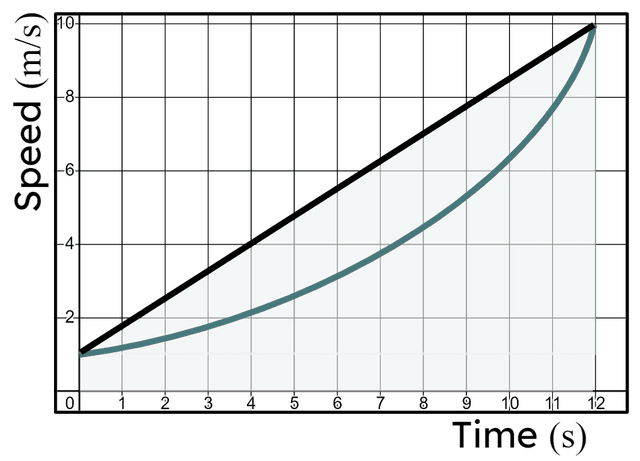
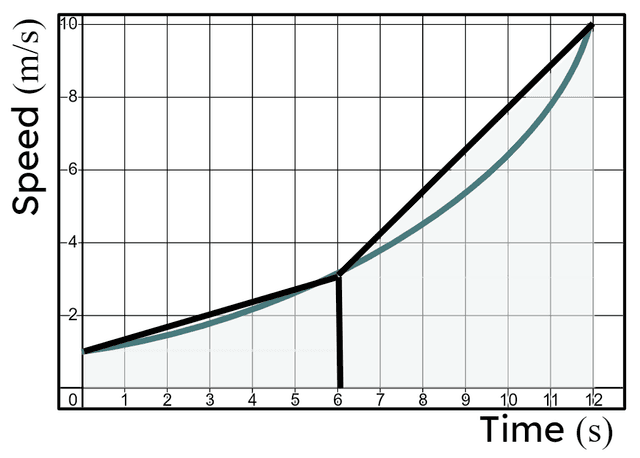
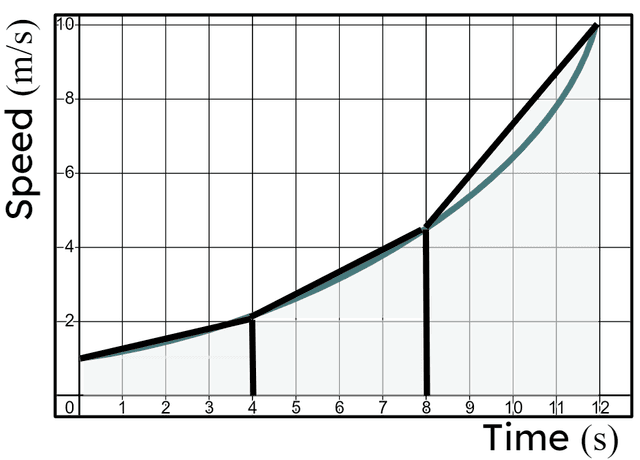
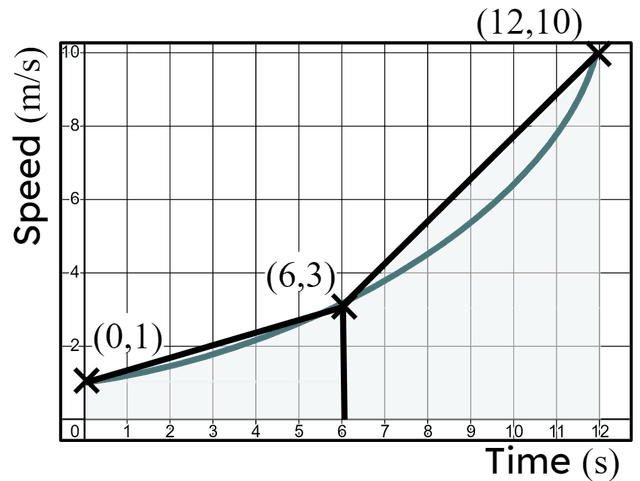
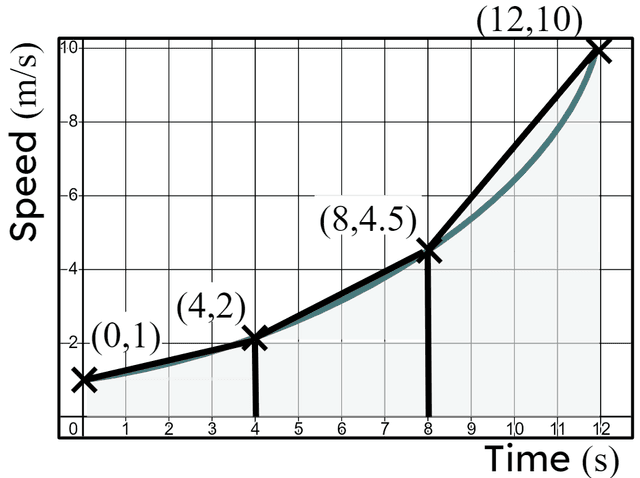
  1. For non-linear graphs, this can be estimated by considering a trapezium.
  2. The more trapezia used, the better the estimate.

Common misconception

When students find an area they are used to communicating the answer in units$$^2$$. The area under a speed-time graph tells us the distance travelled though.

On the graph the base is time and the height is speed which is distance over time. Distance over time, multiplied by time, leaves just distance.

Keywords

  • Estimate - A quick estimate for a calculation is obtained from using approximate values, often rounded to 1 significant figure.

Consider using a starter whereby students work out the area of composite shapes, considering how best to break those shapes down to be as efficient as possible. This will set up them up nicely for the skills needed in this lesson.
Teacher tip

Licence

This content is © Oak National Academy Limited (2024), licensed on Open Government Licence version 3.0 except where otherwise stated. See Oak's terms & conditions (Collection 2).

Loading...

6 Questions

Q1.
An ________ is an estimate for a calculation which is greater than the exact answer.
underestimate
Correct answer: overestimate
miscalculation
approximation
Q2.
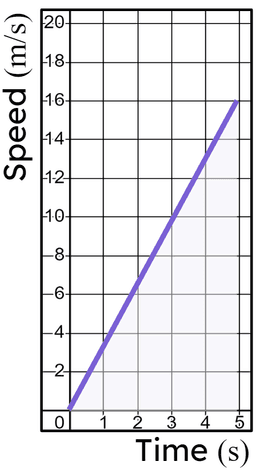
How far has the particle modelled in this graph travelled after $$5$$ seconds?
An image in a quiz
$$5$$ metres
$$16$$ metres
$$5\times16=80$$ metres
Correct answer: $${1\over2}\times5\times16=40$$ metres
$${1\over2}\times5\times20=50$$ metres
Q3.
Which of the below is the formula for the area of a trapezium?
$$A=b\times{h}$$
$$A={1\over2}\times{b}\times{h}$$
$$A={1\over2}\times({a}\times{b})\times{h}$$
Correct answer: $$A={1\over2}\times({a}+{b})\times{h}$$
$$A={1\over2}\times({b}+{h})\times{h}$$
Q4.
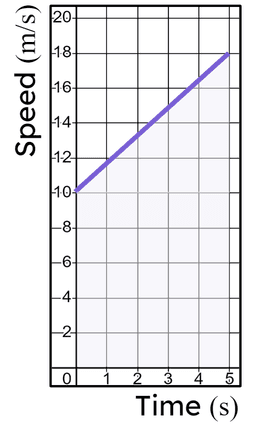
How far has the particle modelled in this graph travelled after $$5$$ seconds? metres.
An image in a quiz
Correct Answer: 70
Q5.
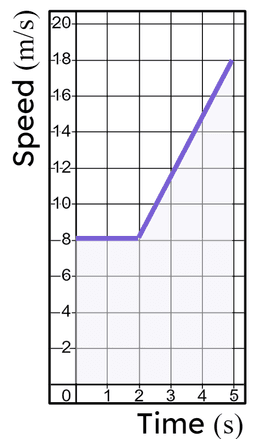
How far has the particle modelled in this graph travelled after $$5$$ seconds? metres.
An image in a quiz
Correct Answer: 55
Q6.
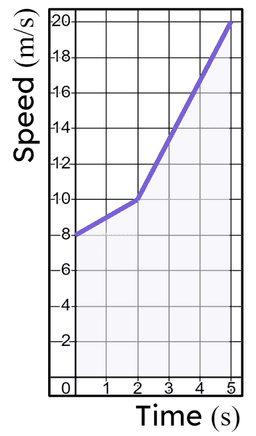
How far has the particle modelled in this graph travelled after $$5$$ seconds? metres.
An image in a quiz
Correct Answer: 63

6 Questions

Q1.
The curve models the movement of a particle. If we had scales on the axes and could find the area of the triangle it would give us __________ for the distance travelled.
An image in a quiz
a large number
a small number
a calculation
an overestimate
Correct answer: an underestimate
Q2.
Use the polygon mapped onto this graph to estimate the distance travelled by the vehicle. Distance $$\approx$$ metres.
An image in a quiz
Correct Answer: 76
Q3.
The area of the polygon will estimate the distance travelled by the vehicle modelled in this graph but this will be __________.
An image in a quiz
an overestimate
Correct answer: an underestimate
exact
Q4.
Which of these groups of polygons will give us the best estimate for the distance modelled by this curve?
An image in a quiz
An image in a quiz
Correct Answer: An image in a quiz
An image in a quiz
Q5.
Use these polygons to estimate the total distance travelled by the particle modelled by this curve. Distance $$\approx$$ metres.
An image in a quiz
Correct Answer: 51
Q6.
Use these polygons to estimate the total distance travelled by the particle modelled by this curve. Distance $$\approx$$ metres.
An image in a quiz
Correct Answer: 48