Myths about teaching can hold you back

- Year 10
- Higher
- Year 10
- Higher
Data collection
I can design and use data collection sheets for different types of data.
Lesson details
Key learning points
- A data collection sheet should be suitable for the type and volume of data.
- Questions should be clear and unambiguous.
- The suitability of recording data in groups should be considered.
Keywords
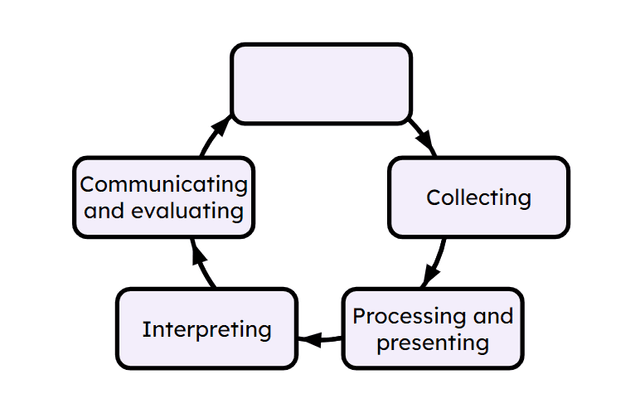
Statistical Enquiry Cycle - The Statistical Enquiry Cycle is a cycle used to carry out a statistical investigation. There are five stages. This is an ongoing process as evaluation may lead to new/refined questioning.
Common misconception
Pupils may struggle to write response boxes that do not overlap for continuous data.
Remind pupils of how to write intervals using inequality symbols.
To help you plan your year 10 maths lesson on: Data collection, download all teaching resources for free and adapt to suit your pupils' needs...
To help you plan your year 10 maths lesson on: Data collection, download all teaching resources for free and adapt to suit your pupils' needs.
The starter quiz will activate and check your pupils' prior knowledge, with versions available both with and without answers in PDF format.
We use learning cycles to break down learning into key concepts or ideas linked to the learning outcome. Each learning cycle features explanations with checks for understanding and practice tasks with feedback. All of this is found in our slide decks, ready for you to download and edit. The practice tasks are also available as printable worksheets and some lessons have additional materials with extra material you might need for teaching the lesson.
The assessment exit quiz will test your pupils' understanding of the key learning points.
Our video is a tool for planning, showing how other teachers might teach the lesson, offering helpful tips, modelled explanations and inspiration for your own delivery in the classroom. Plus, you can set it as homework or revision for pupils and keep their learning on track by sharing an online pupil version of this lesson.
Explore more key stage 4 maths lessons from the Sampling unit, dive into the full secondary maths curriculum, or learn more about lesson planning.

Licence
Lesson video
Loading...
Prior knowledge starter quiz
6 Questions
Q1.Bias can be present in any sample collected from a and may affect the results of a statistical investigation.
Q2.Izzy rolls a dice twice and it lands on a 6 each time. Izzy concludes the dice is biased. Is Izzy correct?
Q3.Which stage is missing from this Statistical Enquiry Cycle?
Q4.Andeep wants to find out what computer game is most popular among year 10 pupils at his school. He asks 6 of his friends what their favourite game is. Which of these comments are correct?
Q5.Sofia is draws a pie chart to show how often people visit the gym. Which stage of the Statistical Enquiry Cycle does this event fit in?
Q6.Match each stage of the Statistical Enquiry Cycle to an event.
Deciding to research different revision methods
Surveying pupils to find out how they revise
Using a spreadsheet to analyse the data
Looking at results and deciding what they show
Concluding which revision method is most used
Assessment exit quiz
6 Questions
Q1.There are stages are there in the Statistical Enquiry Cycle.
Q2.Sofia is a conducting a survey about food. One of her questions is "Healthy people eat a lot of vegetables. Do you like to eat vegetables?" What is wrong with Sofia's question?
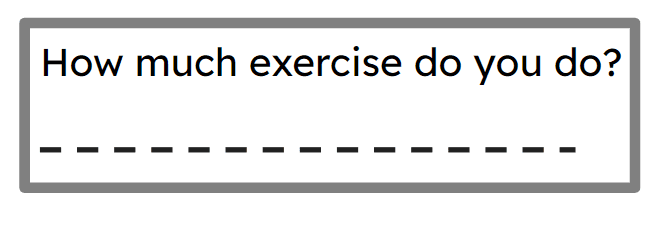
Q3.Jun carries out a survey to find out how much exercise people do. How could Jun's question be improved?
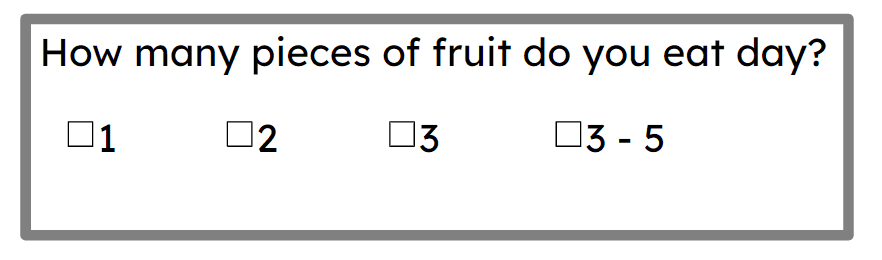
Q4.Aisha wants to find out how much fruit people eat. What is wrong with Aisha's question?
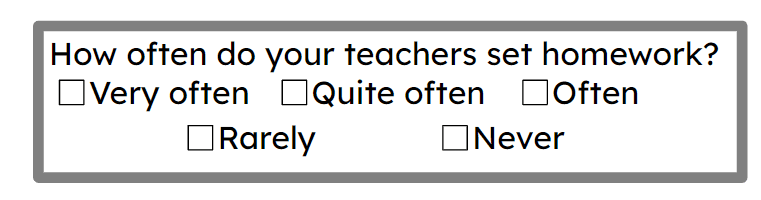
Q5.The Oak Headteacher wants to find out how much homework the teachers set. The Headteacher designs this question. What is wrong with their question?