Velocity on a graph (v = x ÷ t)
I can sketch accurate displacement-time graphs of different motions.
Velocity on a graph (v = x ÷ t)
I can sketch accurate displacement-time graphs of different motions.
These resources will be removed by end of Summer Term 2025.
Lesson details
Key learning points
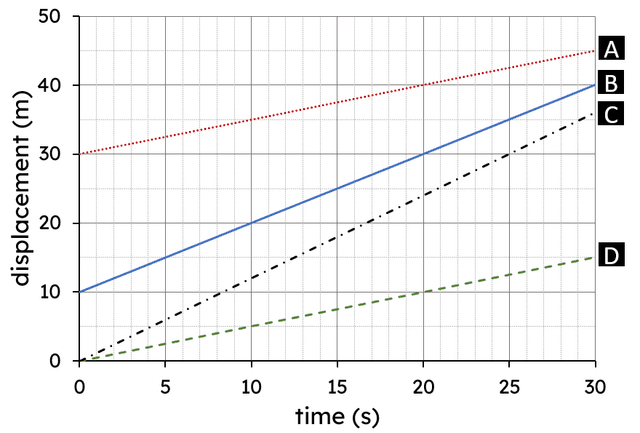
- The velocity of an object is equal to the gradient of a displacement-time graph.
- A direction in which velocity and displacement are measured needs to be chosen.
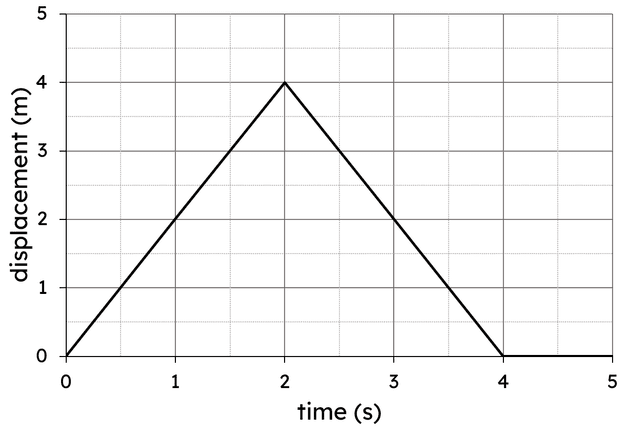
- A negative gradient on a displacement-time graph (sloping downwards) represents velocity in the opposite direction.
- A negative value for displacement represents a position ‘behind’ the starting position.
Keywords
Displacement - The displacement of an object is the distance and direction from a specific point. Displacement is a vector.
Displacement-time graph - A displacement-time graph shows the displacement of an object over a period of time.
Motion sensor - A motion sensor measures the distance between itself and an object. We can use the measurements to calculate and plot graphs of displacement, velocity and acceleration.
Common misconception
Negative values on a displacement-time graph always represent motion that is backwards.
Provide opportunities for pupils to plot a range of displacement-time graphs in real time in order for them to understand how the graph represents different motions.
To help you plan your year 10 physics lesson on: Velocity on a graph (v = x ÷ t), download all teaching resources for free and adapt to suit your pupils' needs...
To help you plan your year 10 physics lesson on: Velocity on a graph (v = x ÷ t), download all teaching resources for free and adapt to suit your pupils' needs.
The starter quiz will activate and check your pupils' prior knowledge, with versions available both with and without answers in PDF format.
We use learning cycles to break down learning into key concepts or ideas linked to the learning outcome. Each learning cycle features explanations with checks for understanding and practice tasks with feedback. All of this is found in our slide decks, ready for you to download and edit. The practice tasks are also available as printable worksheets and some lessons have additional materials with extra material you might need for teaching the lesson.
The assessment exit quiz will test your pupils' understanding of the key learning points.
Our video is a tool for planning, showing how other teachers might teach the lesson, offering helpful tips, modelled explanations and inspiration for your own delivery in the classroom. Plus, you can set it as homework or revision for pupils and keep their learning on track by sharing an online pupil version of this lesson.
Explore more key stage 4 physics lessons from the Measuring and calculating motion unit, dive into the full secondary physics curriculum, or learn more about lesson planning.

Equipment
See additional materials.
Content guidance
- Risk assessment required - equipment
Supervision
Adult supervision required
Licence
Lesson video
Starter quiz
6 Questions


Exit quiz
6 Questions
a vector which is the distance and direction from a point
a vector that gives speed and direction
shows the displacement of an object over a period of time
measures the distance between an object and itself