Myths about teaching can hold you back
- Year 10
- OCR
- Higher
Interpreting I–V graphs
I can take readings from I–V graphs and use these to describe the changing resistance of a component.
- Year 10
- OCR
- Higher
Interpreting I–V graphs
I can take readings from I–V graphs and use these to describe the changing resistance of a component.
These resources were made for remote use during the pandemic, not classroom teaching.
Switch to our new teaching resources now - designed by teachers and leading subject experts, and tested in classrooms.
Lesson details
Key learning points
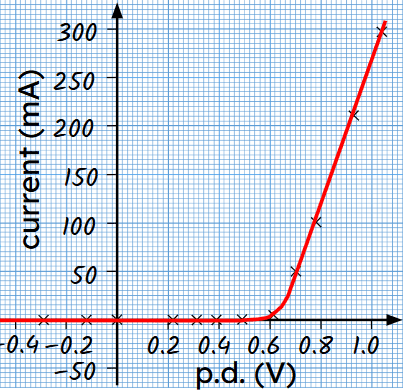
- In forward–bias, a diode has a very small resistance when the p.d. is larger than the threshold voltage.
- In reverse–bias, a diode has a very large resistance and very little current can flow.
- The greater the p.d. across a component, the larger the push on electric charges in the component.
- The resistance of a component is calculated from an I–V graph using pairs of readings and the equation R = V ÷ I.
- The greater the current through a component, the larger the heating effect on it.
Keywords
Reverse–bias - When a diode is reverse–biased, it prevents current from flowing.
Forward–bias - When a diode is forward–biased, it allows current to flow.
Threshold p.d. - The threshold p.d. is the potential difference at which a diode allows current to flow.
Fuse - A fuse is a component that has a wire that melts if the current is too high.
Ion lattice - In a solid metal, the regular and repeating pattern that metal ions are arranged in is known as an ion lattice.
Common misconception
Pupils often cannot apply the main I–V graphs to similar components.
Describe how the p.d. and current in components behaves to draw out similarities that can be used to describe unfamiliar components.
To help you plan your year 10 physics lesson on: Interpreting I–V graphs, download all teaching resources for free and adapt to suit your pupils' needs...
To help you plan your year 10 physics lesson on: Interpreting I–V graphs, download all teaching resources for free and adapt to suit your pupils' needs.
The starter quiz will activate and check your pupils' prior knowledge, with versions available both with and without answers in PDF format.
We use learning cycles to break down learning into key concepts or ideas linked to the learning outcome. Each learning cycle features explanations with checks for understanding and practice tasks with feedback. All of this is found in our slide decks, ready for you to download and edit. The practice tasks are also available as printable worksheets and some lessons have additional materials with extra material you might need for teaching the lesson.
The assessment exit quiz will test your pupils' understanding of the key learning points.
Our video is a tool for planning, showing how other teachers might teach the lesson, offering helpful tips, modelled explanations and inspiration for your own delivery in the classroom. Plus, you can set it as homework or revision for pupils and keep their learning on track by sharing an online pupil version of this lesson.
Explore more key stage 4 physics lessons from the Circuit components unit, dive into the full secondary physics curriculum, or learn more about lesson planning.

Licence
Prior knowledge starter quiz
6 Questions
Q1.What is the function of a diode?
Q2.What does it mean when a diode is in reverse bias?
Q3.Which of these has a symmetrical I-V graph for both positive and negative p.d.?
Q4.Which of the following correctly describes how a fuse wire works?
Q5.What is the resistance of a diode if it allows 0.16 A to flow when the p.d. across it is 0.8 V?
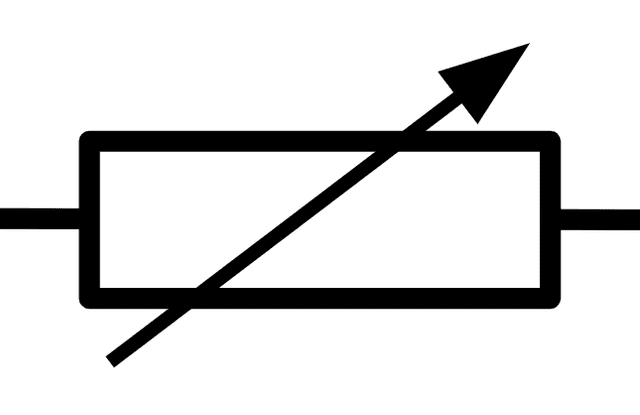
Q6.How does this component work?

Assessment exit quiz
6 Questions
Q1.The characteristics of which component are shown by this I-V graph?

Q2.The characteristics of a diode are shown by this I-V graph. What is its threshold voltage?


