Myths about teaching can hold you back
- Year 7
Reducing friction: analysis
I can analyse data from an investigation to test the effectiveness of different lubricants.
- Year 7
Reducing friction: analysis
I can analyse data from an investigation to test the effectiveness of different lubricants.
These resources were made for remote use during the pandemic, not classroom teaching.
Switch to our new teaching resources now - designed by teachers and leading subject experts, and tested in classrooms.
Lesson details
Key learning points
- Categoric variables come in distinct types. Continous variables can take any value on a numerical scale.
- Bar charts are used when the variable you changed in an experiment is categoric.
- An effective lubricant reduces the friction force.
- A conclusion states what you found out in an experiment and also explains how you know.
Keywords
Lubricant - A lubricant is a substance added between two surfaces to reduce friction.
Friction - Friction is the force of one surface gripping or rubbing on another.
Categoric - A variable is categoric if it comes in distinct, separate categories.
Continuous - A variable is continuous if it can take any value, including decimals, on a scale of numbers.
Conclusion - A conclusion states what you found out in an experiment and explains how you know.
Common misconception
The type of graph chosen to represent data can just be personal choice.
Specific kinds of graph should be chosen to represent specific kinds of data.
To help you plan your year 7 science lesson on: Reducing friction: analysis, download all teaching resources for free and adapt to suit your pupils' needs...
To help you plan your year 7 science lesson on: Reducing friction: analysis, download all teaching resources for free and adapt to suit your pupils' needs.
The starter quiz will activate and check your pupils' prior knowledge, with versions available both with and without answers in PDF format.
We use learning cycles to break down learning into key concepts or ideas linked to the learning outcome. Each learning cycle features explanations with checks for understanding and practice tasks with feedback. All of this is found in our slide decks, ready for you to download and edit. The practice tasks are also available as printable worksheets and some lessons have additional materials with extra material you might need for teaching the lesson.
The assessment exit quiz will test your pupils' understanding of the key learning points.
Our video is a tool for planning, showing how other teachers might teach the lesson, offering helpful tips, modelled explanations and inspiration for your own delivery in the classroom. Plus, you can set it as homework or revision for pupils and keep their learning on track by sharing an online pupil version of this lesson.
Explore more key stage 3 science lessons from the Forces unit, dive into the full secondary science curriculum, or learn more about lesson planning.

Licence
Prior knowledge starter quiz
6 Questions
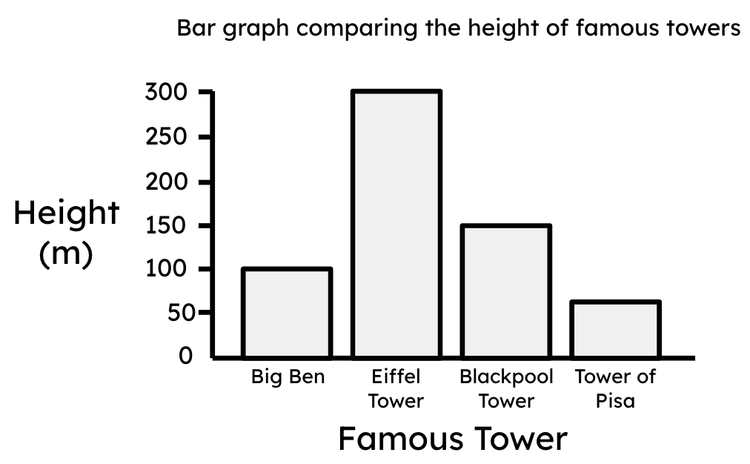
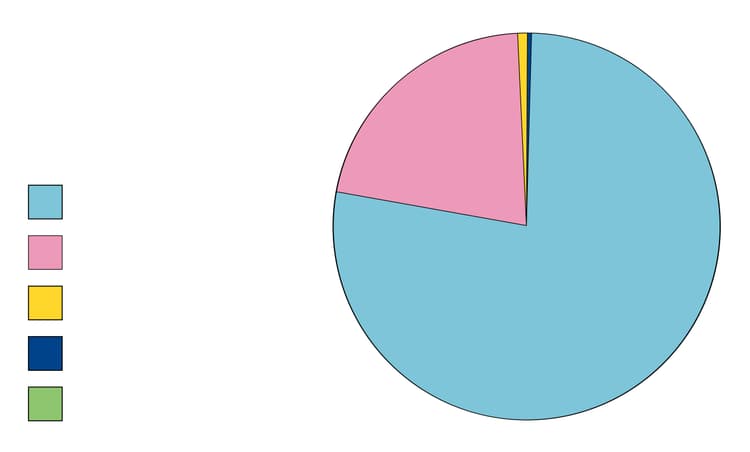
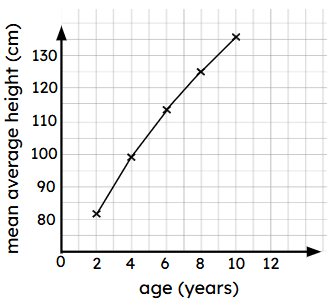
Q1.Which picture shows a bar chart?
Q2.In an experiment, anything that could change (vary) between tests is called a ...
Q3.Which option correctly describes what an experiment conclusion should contain?
Q4.Which kind of force does a lubricant reduce?
Q5.Which one of these variables comes in different categories?
Q6.Identify the possible benefits of lubricating moving parts of a system, to reduce the friction.
Assessment exit quiz
6 Questions
Q1.A is any substance added between two surfaces to reduce the friction forces.
Q2.Which part of an experiment write-up states what you found out and explains how you know?
Q3.Which of the below is the name for a variable that comes in distinct, separate types or categories?
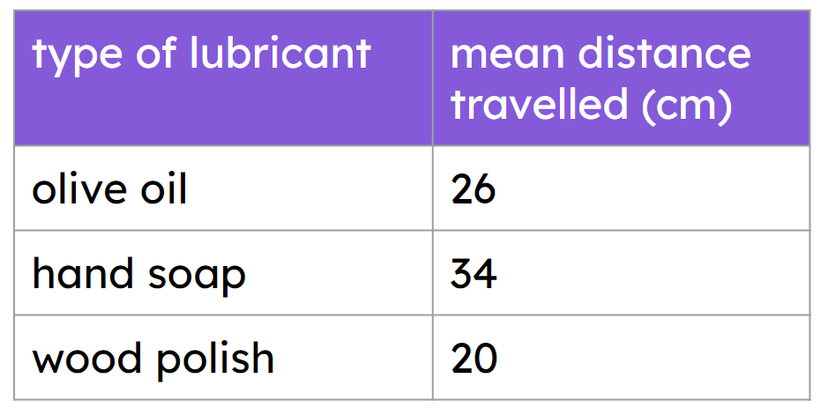
Q4.Jun did an experiment to test how far objects slide across a surface lubricated with different lubricants. His results are in the table. Which of the below is a correct conclusion from Jun's results?
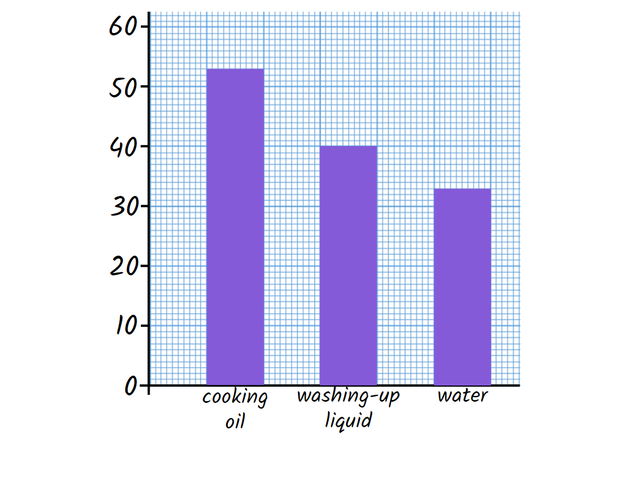
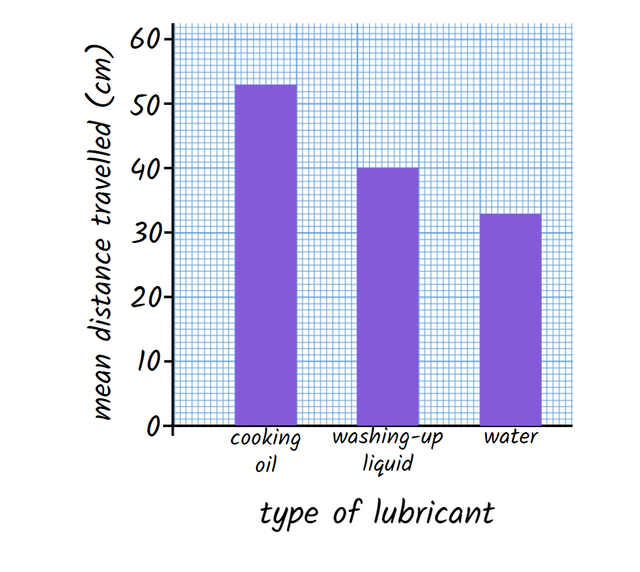
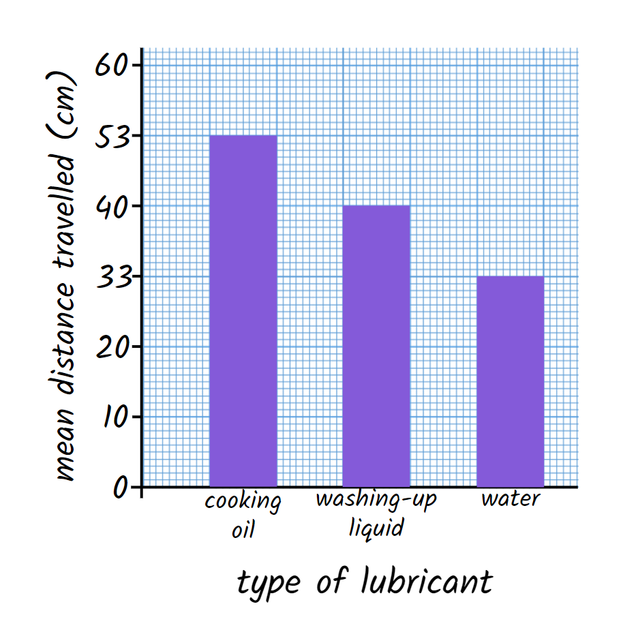
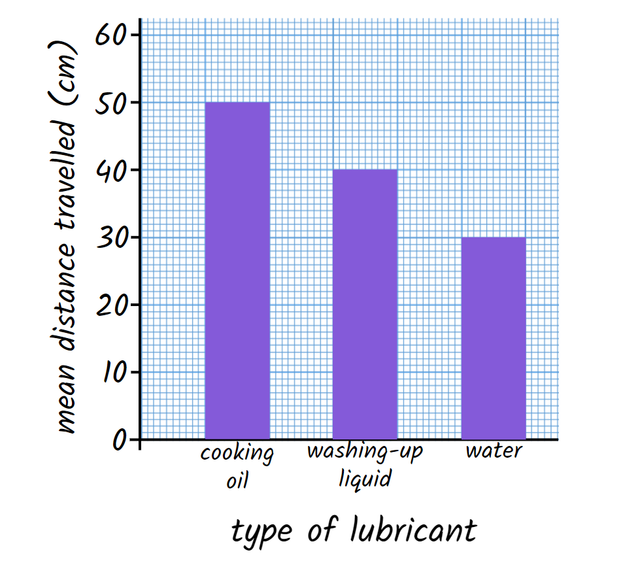
Q5.Izzy tested how far masses slide with different lubricants. The mass slid 53 cm on cooking oil, 40 cm on washing-up liquid and 33 cm on water. Which is the best bar chart of these results?
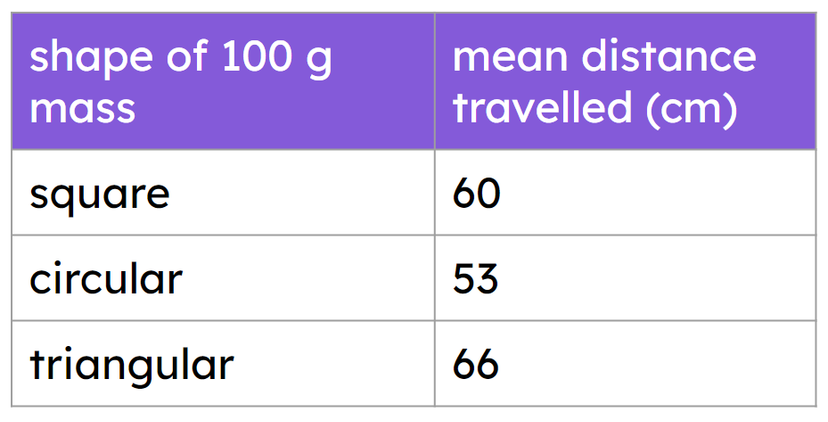
Q6.Laura tested how far different shaped 100 g masses slide across the same surface. Her results are shown in the table. Which option correctly explains what type of graph Laura should draw?
