Myths about teaching can hold you back

- Year 8
Cooling curve: practical
I can conduct an investigation to create and analyse cooling curves and identify where state changes are happening on temperature vs time graphs.
- Year 8
Cooling curve: practical
I can conduct an investigation to create and analyse cooling curves and identify where state changes are happening on temperature vs time graphs.
Lesson details
Key learning points
- State changes are visible as plateaus on cooling curves.
- As it cools, a substance transfers energy into the surroundings by heating and it may condense or freeze.
- Energy is released to the surroundings as a substance cools and this is observed as a decrease in substance temperature.
- Graphs provide a visual representation of data for easier analysis and help identify trends/patterns.
Keywords
Plateau - A plateau is a section of a graph that does not change value (stays at the same level for a period of time).
Melting point - The melting point of a substance is the temperature at which it changes from solid state to a liquid state.
Freezing - Freezing is the process of a substance changing from a liquid state to a solid state.
Temperature - Measured using a thermometer (commonly in °C). Temperature is an indirect measure of the energy of the particles in a substance.
Common misconception
All substances freeze when really cold, like water.
Show state changes using particle diagrams / kinetic energy model. Challenge pupils to identify state given real world temperature data.
To help you plan your year 8 science lesson on: Cooling curve: practical, download all teaching resources for free and adapt to suit your pupils' needs...
To help you plan your year 8 science lesson on: Cooling curve: practical, download all teaching resources for free and adapt to suit your pupils' needs.
The starter quiz will activate and check your pupils' prior knowledge, with versions available both with and without answers in PDF format.
We use learning cycles to break down learning into key concepts or ideas linked to the learning outcome. Each learning cycle features explanations with checks for understanding and practice tasks with feedback. All of this is found in our slide decks, ready for you to download and edit. The practice tasks are also available as printable worksheets and some lessons have additional materials with extra material you might need for teaching the lesson.
The assessment exit quiz will test your pupils' understanding of the key learning points.
Our video is a tool for planning, showing how other teachers might teach the lesson, offering helpful tips, modelled explanations and inspiration for your own delivery in the classroom. Plus, you can set it as homework or revision for pupils and keep their learning on track by sharing an online pupil version of this lesson.
Explore more key stage 3 science lessons from the Fuels and energetics unit, dive into the full secondary science curriculum, or learn more about lesson planning.

Equipment
Content guidance
- Risk assessment required - equipment
Supervision
Adult supervision required
Licence
Lesson video
Loading...
Prior knowledge starter quiz
6 Questions
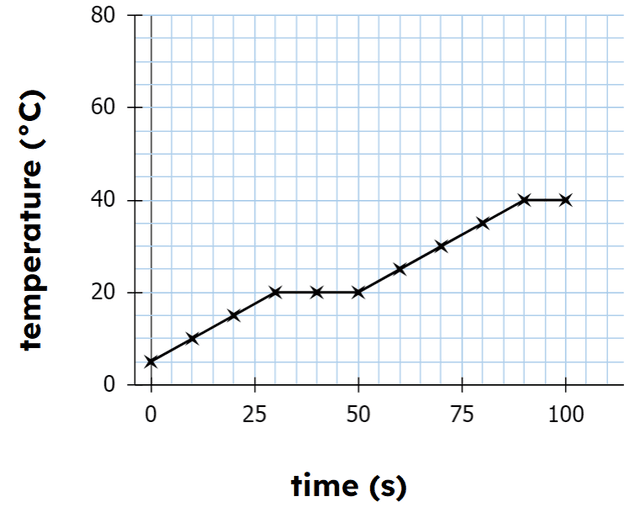
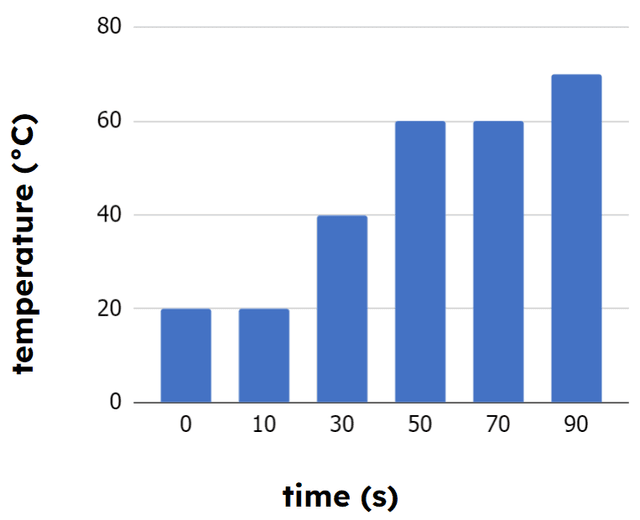
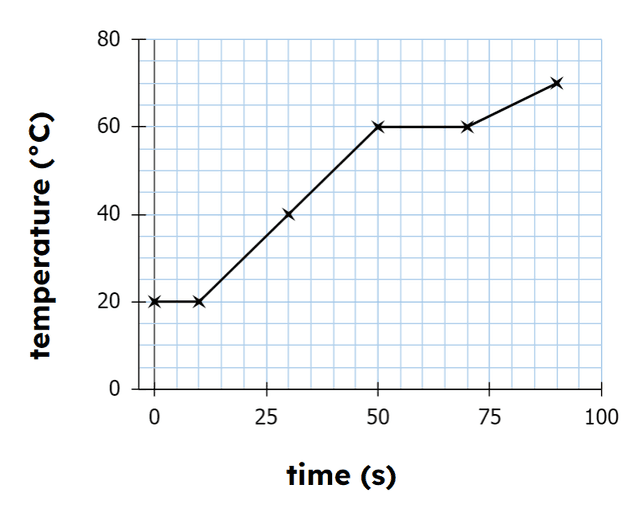
Q1.Which of the following is the most appropriate way to show the change in temperature over time?

Q2.The term used to describe the energy transfer from an object to its surroundings as it cools is...
Q3.True or false? In the gas state, particles have enough energy to move freely and are not held in fixed positions.
Q4.What happens to the particles of a substance when it is heated and reaches its boiling point?
Q5.The temperature at which a substance changes from solid to liquid is known as its...
Q6.Match the state of matter to the description about forces of attraction.
particles have the strongest forces of attraction
particles have some (weakened) forces of attraction
particles have fully overcome forces of attraction
Assessment exit quiz
6 Questions
Q1.On a heating curve, what does a plateau indicate?
Q2.The point on a cooling curve where a liquid starts to solidify is called the point.
Q3.How does energy transfer during the cooling of a substance?
Q4.Which state changes are shown in this heating curve?
Q5.At what temperature (℃) does this substance begin to melt? (give only the number, not the unit)