Myths about teaching can hold you back

- Year 8
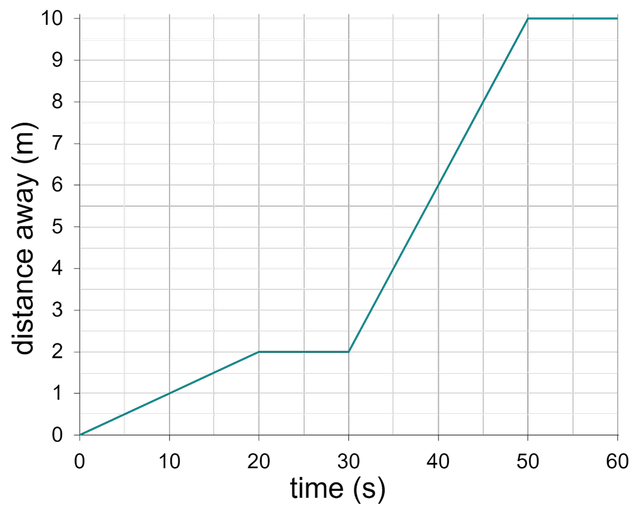
Interpreting distance-time graphs
I can describe the movement of objects represented by a distance-time graph.
- Year 8
Interpreting distance-time graphs
I can describe the movement of objects represented by a distance-time graph.
Lesson details
Key learning points
- A level line on a distance-time graph shows a stationary object (no movement).
- The greater the gradient (steeper the line) on a distance-time graph, the faster the movement.
- Upward and downward sloping lines on a distance-time graph show movement in opposite directions.
- The average speed between two points is calculated using speed = change in distance ÷ time taken.
Keywords
Distance-time graph - A distance-time graph is used to show how far an object has travelled over a period of time.
Average speed - The overall distance travelled divided by overall time for a journey.
Gradient - The gradient (steepness) of a line on a distance-time graph shows its speed. Higher gradients (steeper lines) show faster objects.
Stationary - A stationary object is not moving. It has a speed of 0 m/s.
Common misconception
Pupils can think that a distance or time value read from a distance-time graph is the speed.
Remind pupils of the definition of speed, pointing out that it requires two pieces of information to find - both the distance and time.
To help you plan your year 8 science lesson on: Interpreting distance-time graphs, download all teaching resources for free and adapt to suit your pupils' needs...
To help you plan your year 8 science lesson on: Interpreting distance-time graphs, download all teaching resources for free and adapt to suit your pupils' needs.
The starter quiz will activate and check your pupils' prior knowledge, with versions available both with and without answers in PDF format.
We use learning cycles to break down learning into key concepts or ideas linked to the learning outcome. Each learning cycle features explanations with checks for understanding and practice tasks with feedback. All of this is found in our slide decks, ready for you to download and edit. The practice tasks are also available as printable worksheets and some lessons have additional materials with extra material you might need for teaching the lesson.
The assessment exit quiz will test your pupils' understanding of the key learning points.
Our video is a tool for planning, showing how other teachers might teach the lesson, offering helpful tips, modelled explanations and inspiration for your own delivery in the classroom. Plus, you can set it as homework or revision for pupils and keep their learning on track by sharing an online pupil version of this lesson.
Explore more key stage 3 science lessons from the Moving by force unit, dive into the full secondary science curriculum, or learn more about lesson planning.

Equipment
Licence
Lesson video
Loading...
Prior knowledge starter quiz
6 Questions
Q1.Match the feature of the distance-time graph to what it is for.
shows the time
shows the distance
shows the maximum and minimum values
shows the speed of an object
numbers on the axis so that values can be read
lines from the axes that allow readings to be read easily
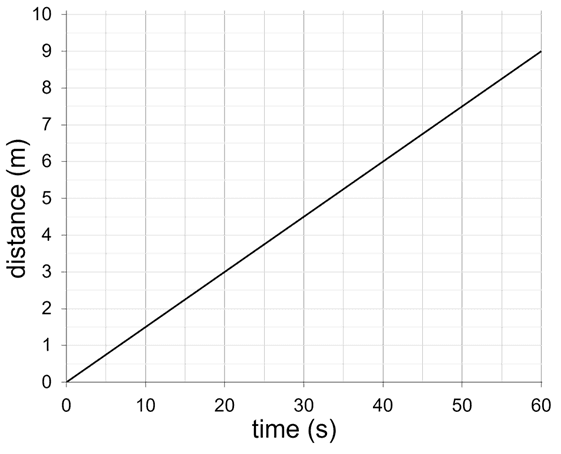
Q2.Use the graph to find out how far this object has travelled in 60 s. Include the unit in your answer.
Q3.Use the graph to find out how long it takes this object to travel 6 m. Include the unit in your answer.
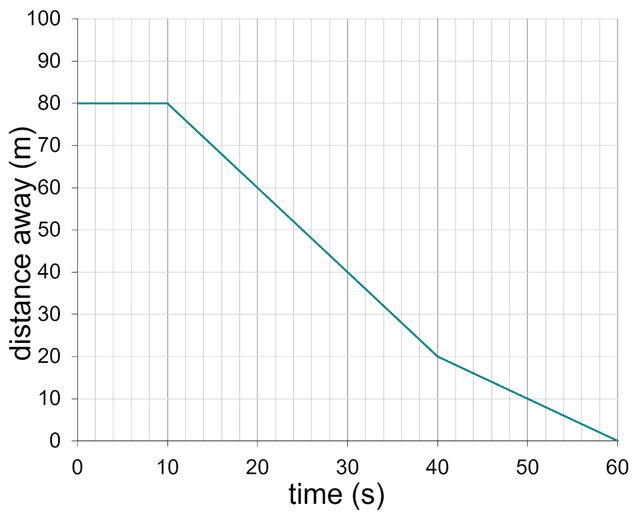
Q4.How far does this object travel between 10 s and 40 s?
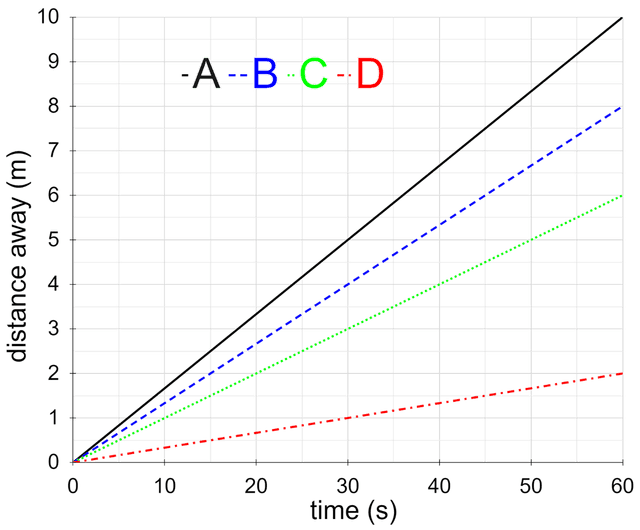
Q5.Starting with the fastest, put the objects shown on the graph in order of average speed.
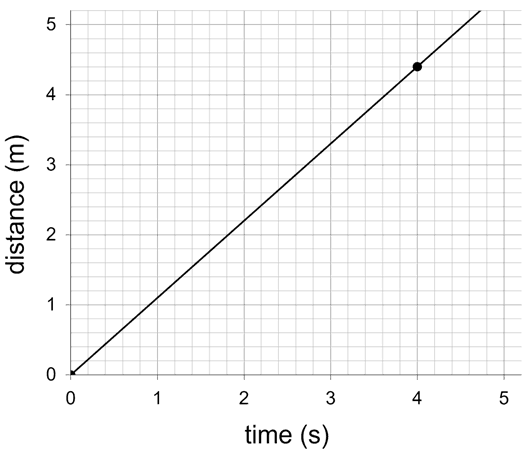
Q6.Use the graph to calculate the average speed of the object.
Assessment exit quiz
6 Questions
Q1.Match the key word to the description.
The total distance travelled divided by the total time.
The steepness of a line on a graph.
Shows the distance something has moved at each moment.
Another name for the gradient of a graph.
Not moving.
Q2.At what time does this object start moving closer? Include the unit in your answer.
Q3.Which of the objects shown by the four lines has the lowest average speed?
Q4.Which of the objects shown by the four lines has a speed of 0.13 m/s?
Q5.Calculate the average speed for this complete journey.
Q6.Calculate the average speed between 10 s and 30 s for this journey.