Myths about teaching can hold you back

- Year 7
Saturated solutions
I can compare data involving the solubility of different solutes and use it to describe saturation.
- Year 7
Saturated solutions
I can compare data involving the solubility of different solutes and use it to describe saturation.
Lesson details
Key learning points
- At a given temperature, there is a limit to how much solute can dissolve in a solvent.
- Solutes may become insoluble as a solution cools.
- Lines of best fit can be used to predict unknowns values if one variable is known.
- Data from multiple investigations can be plotted on the same graph for ease of comparison.
Keywords
Saturated solution - A saturated solution is one in which no more solute can dissolve in the solvent at a given temperature.
Solubility - Solubility refers to how well a solute is able to dissolve in a solvent to create a solution.
Line of best fit - A line that depicts the trend of scattered data plots on a graph.
Common misconception
Pupils are reluctant/struggle to plot multiple sets of data on one graph.
Fold the table of results so pupils are only looking at one set of data at a time when plotting. Use different plot symbols/colours too.
To help you plan your year 7 science lesson on: Saturated solutions, download all teaching resources for free and adapt to suit your pupils' needs...
To help you plan your year 7 science lesson on: Saturated solutions, download all teaching resources for free and adapt to suit your pupils' needs.
The starter quiz will activate and check your pupils' prior knowledge, with versions available both with and without answers in PDF format.
We use learning cycles to break down learning into key concepts or ideas linked to the learning outcome. Each learning cycle features explanations with checks for understanding and practice tasks with feedback. All of this is found in our slide decks, ready for you to download and edit. The practice tasks are also available as printable worksheets and some lessons have additional materials with extra material you might need for teaching the lesson.
The assessment exit quiz will test your pupils' understanding of the key learning points.
Our video is a tool for planning, showing how other teachers might teach the lesson, offering helpful tips, modelled explanations and inspiration for your own delivery in the classroom. Plus, you can set it as homework or revision for pupils and keep their learning on track by sharing an online pupil version of this lesson.
Explore more key stage 3 science lessons from the Solutions unit, dive into the full secondary science curriculum, or learn more about lesson planning.

Licence
Lesson video
Loading...
Prior knowledge starter quiz
6 Questions
Q1.What happens to most solutes as the temperature of a solvent increases?
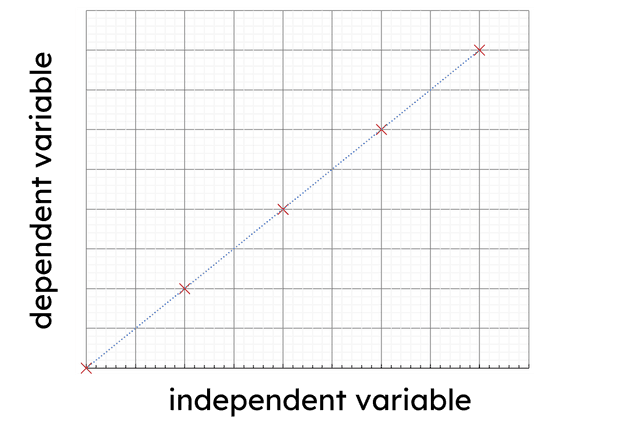
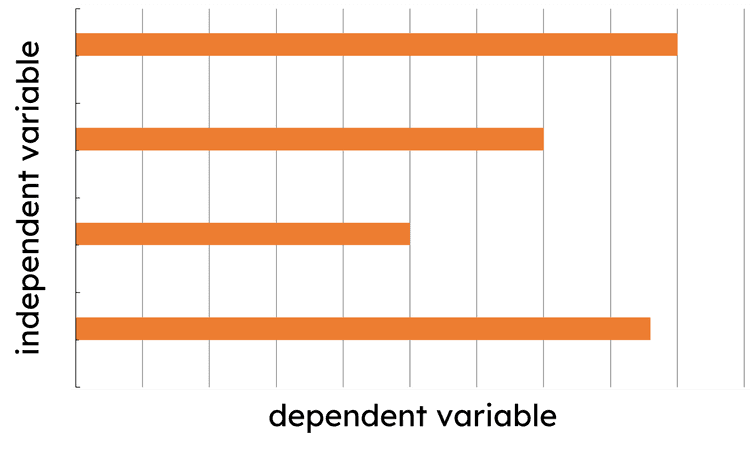
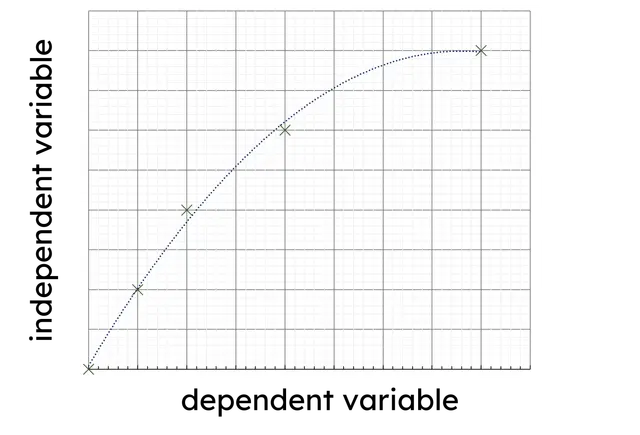
Q2.When drawing a graph in science, which of the following graphs have their variables plotted correctly?
Q3.What is typically used in science to predict values from a graph?
Q4.Solubility is a description of how well a solvent can dissolve into a solute.
Q5.What type of graph is most appropriate for showing the relationship between suggested variables? KEY: Independent variable (IV) | Dependent variable (DV)
IV: hair colour | DV: number of students
IV: mass of sugar | DV: time taken to dissolve
IV: shoe size | DV: favourite food
Q6.The term for the measure of how much a substance can dissolve in a given amount of solvent at a specific temperature is...
Assessment exit quiz
6 Questions
Q1.What observation indicates that a solution has become saturated?
Q2.A line of best fit on a solubility graph can be used to predict the solubility of a solute at temperatures not directly tested.
Q3.When solutes become insoluble as a solution cools, it may lead to the formation of...
Q4.The process of a solute dissolving in a solvent until no more can dissolve at a particular temperature is known as reaching...
Q5.Match the following key terms to their descriptions.
Describes something that can dissolve in a solvent.
Describes something that cannot dissolve in a solvent.
A solution that cannot dissolve any more solute.
The mixture formed between solute and solvent.
A measure of how well something dissolves.
A substance that can dissolve to form a solution.
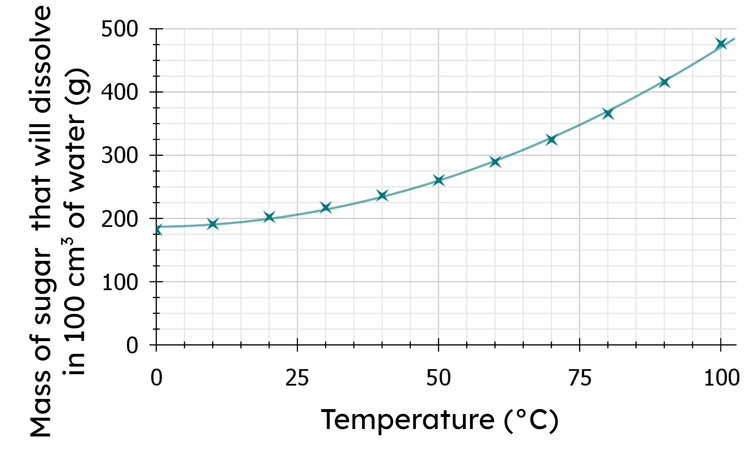
Q6.Use the graph to determine the mass (in grams) of sugar that will dissolve in 100 cm³ of water at 85℃. (Give the number to the nearest hundred).