Myths about teaching can hold you back

- Year 7
Solubility: analysis
I can draw an appropriate representation of solubility data and use it to write a conclusion.
- Year 7
Solubility: analysis
I can draw an appropriate representation of solubility data and use it to write a conclusion.
Lesson details
Key learning points
- Scientists transfer data to graphs in order to find any trends in the collected data.
- The type of data collected affects the type of graph used to present it.
- A line of best fit can help to identify and describe relationships between variables.
- Conclusions refer to both the independent and dependent variables when describing the data collected.
Keywords
Discrete data - Data that can only take distinct values or is a category, e.g. shoe size, number of people.
Continuous data - Data that can be a value within a range, e.g. temperature, mass, height, etc.
Bar chart - Chart showing solid columns to present data; usually used when one variable is discrete.
Scatter graph - A graph in which two continuous variables are plotted. It is used to find if a relationship exists between the variables.
Line of best fit - A line of best fit is drawn through a set of plotted points on a scatter graph, to best show the trend in the data displayed.
Common misconception
Pupils commonly confuse discrete & continuous data. They also think lines of best fit are straight.
Link *how* the data is collected to the type of data it is. Stress that best fit lines are just that - a best fit - they aren't exact!
To help you plan your year 7 science lesson on: Solubility: analysis, download all teaching resources for free and adapt to suit your pupils' needs...
To help you plan your year 7 science lesson on: Solubility: analysis, download all teaching resources for free and adapt to suit your pupils' needs.
The starter quiz will activate and check your pupils' prior knowledge, with versions available both with and without answers in PDF format.
We use learning cycles to break down learning into key concepts or ideas linked to the learning outcome. Each learning cycle features explanations with checks for understanding and practice tasks with feedback. All of this is found in our slide decks, ready for you to download and edit. The practice tasks are also available as printable worksheets and some lessons have additional materials with extra material you might need for teaching the lesson.
The assessment exit quiz will test your pupils' understanding of the key learning points.
Our video is a tool for planning, showing how other teachers might teach the lesson, offering helpful tips, modelled explanations and inspiration for your own delivery in the classroom. Plus, you can set it as homework or revision for pupils and keep their learning on track by sharing an online pupil version of this lesson.
Explore more key stage 3 science lessons from the Solutions unit, dive into the full secondary science curriculum, or learn more about lesson planning.

Licence
Lesson video
Loading...
Prior knowledge starter quiz
6 Questions
Q1.What is the role of an independent variable in an experiment?
Q2.What is the primary reason for recording data in a table during an experiment?
Q3.When results from an experiment are reproduced by different people or in different places, it is known as...
Q4.A well-designed scientific experiment should yield the same results regardless of who conducts it. True or false?
Q5.A piece of data that does not fit an obvious trend is known as...
Q6.Match the keywords to the descriptions below.
Solute particles spread throughout the particles of solvent.
How well a solute is able to dissolve in a solvent.
Anything that can change in an investigation.
Mixture of an insoluble solid and liquid that will settle.
A substance that can dissolve in a specific solvent.
A substance that cannot dissolve in a specific solvent.
Assessment exit quiz
6 Questions
Q1.Data that can only take specific, distinct values is called data.
Q2.A scatter graph is the most appropriate choice for representing data when both variables are discrete. True or false?
Q3.Which of the following should always be included when writing a conclusion to an investigation?
Q4.When drawing a line of best fit on a graph, any results that are will be ignored.
Q5.What type of graph is typically used when one variable is discrete?
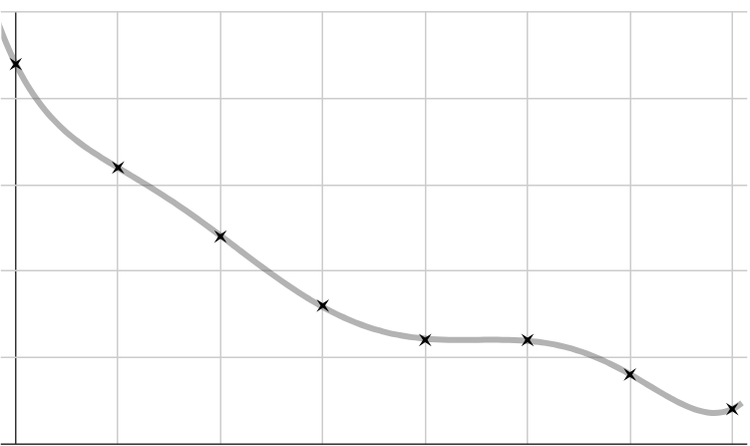
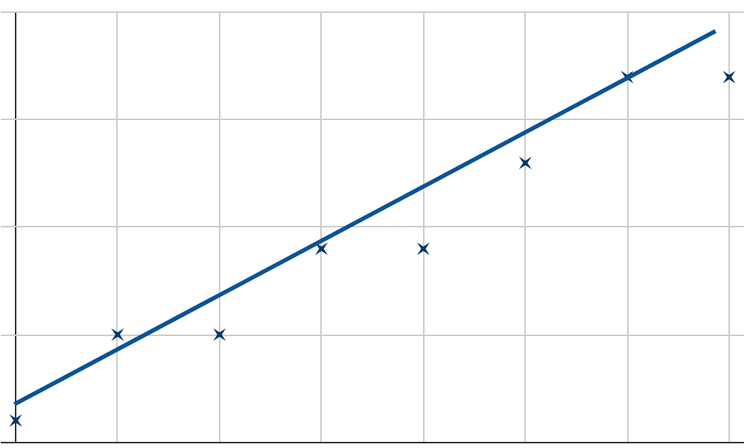
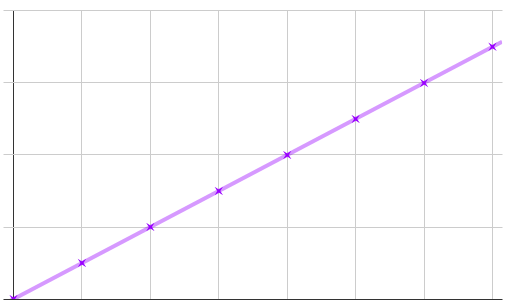
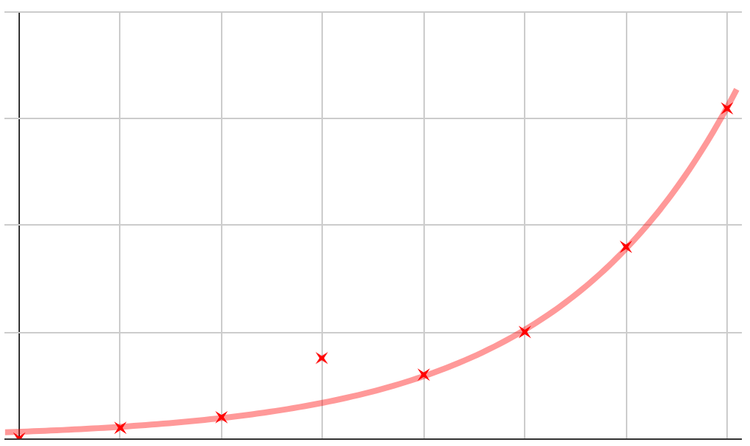
Q6.Which of the following graphs below show a suitable line of best fit based on the data plotted?